

")
 Forex levels are the most basic and fundamental aspect of price movements. Levels come to the fore and become the starting line of price movement and opening of order. And levels become the target of price trend. There are reasons for it. Forex levels appear in the technical analysis as well as the fundamental one, when after certain events, which are to come or already happen, the price is expected movements to move towards certain values.
So, let's look at levels closer. The most common terms here are levels of support and resistance. They can be determined simply.
The line of support is the line that is placed on the two minimums or maximums and supports the direction of price movement. It moves from the line.
The line of resistance is a line that is also placed on the two minimums or maximums and becomes a target or challenge for the price movement. Price moves to this line.
If the level is overcome, its role usually changes. The level of resistance becomes the level of support. When the price rebounds, the level of resistance becomes the level of support.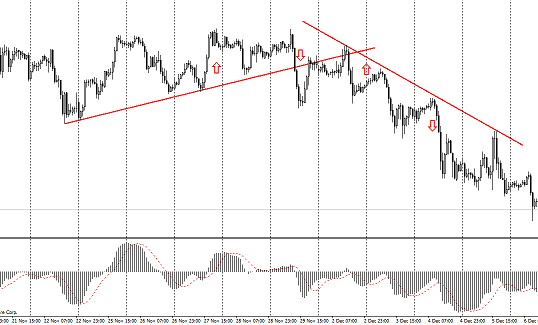
The picture shows two levels. The first level of support becomes the level of resistance when the price breaks trough it and then takes two more attempts to break it trough. After the downward trend appears the resistance level is clearly visible.
Such levels have an important feature. The strength of these lines changes in accordance with the angle. The strongest lines are those lines which lie horizontally. If you find a pair of highs or lows, which form horizontal line of support and resistance, it will show that the rebound will be strong, and the breaking trough will be strong and rather long.
Forex levels do not include lines only. The level can be a simple single maximum or minimum of the time interval. That is, if, for example, the maximum price was achieved last month, it is considered to be the level, which was tested. And then either it will be broken through and the price will move higher, or the price will be rolled back in the opposite direction.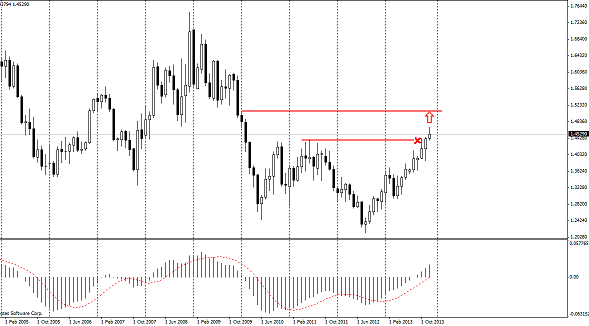
As the graph shows, the price broke through the maximum of 2011 and now its target is on the level of 2010. Although, a simple rebound instead of the penetration could happen there.
And one more important thing, which should be mentioned. This thing is Fibonacci levels. Since they draw lines of support and resistance, which often coincide with the prices’ highs and lows over long periods of time.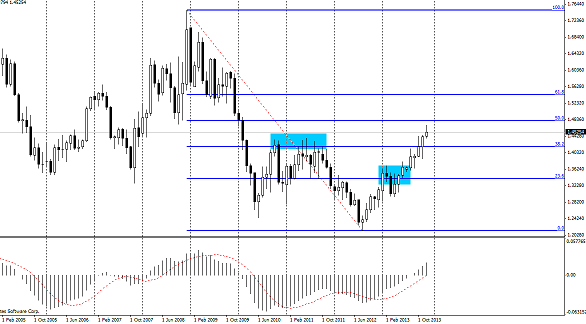
This, in turn, confirms the stability of the price levels of both single and long-term lines of support and resistance.
Thus, the Forex levels are perhaps the most important aspect of the trade. They are used in trading systems, very often being used only. Just use a longer interval of time and try to understand levels and their typical patterns. The diagram shows a scheme where two different levels are used. One of them is the level of maximum and the second is the level of support.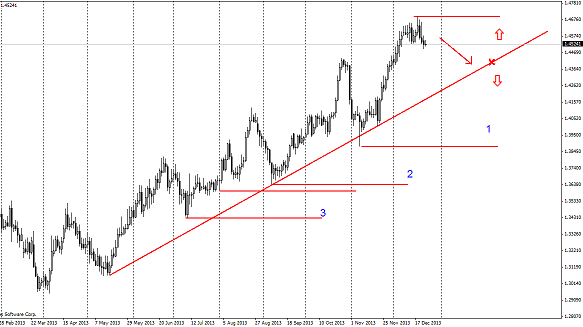
Simplicity and clarity of constructing such range of levels, gives a clear picture of the action. This is a short SELL position from the highest point to the line. If price rebounds then close the SELL position and open the BUY position. It may be a long position, as is the trend is upward. If there is a break through and fall in price, then the first SELL order simply moves profit. The addition of transaction volume is possible as well.
The following picture indicates goals. These goals are also levels. They are resistance levels and when the price moves their relevance may change.
Thus, the Forex levels are a versatile tool, which can help you can to trade effectively on the foreign exchange market. Of course, you can adapt a pair of indicators as well, but this is the only difference. Levels are determined by the price chart directly. And this so-called price "indicator" is not derived and it is also not a result of indirect calculation, but it is the "voice" of price movements itself.
Social button for Joomla