

")
Forex indicators
Forex indicators are auxiliary tools necessary for decision-making in difficult moments, when the behavior of a currency pair is ambiguous. This section provides classification and reviews of new and proven indicators, describes how they work and the settings, gives examples of use. Beginners will be interested in the guide for choosing indicators.
- Details
- Written by Admin
- Category: Forex indicators
- Hits: 12235
Working with binary options involves not only an excellent understanding of the market and analysis skills, but also the use of special technical tools. To avoid turning this specific trading into gambling, a trader needs binary options indicators that provide accurate signals for forward transactions.
- Details
- Written by Admin
- Category: Forex indicators
- Hits: 6767
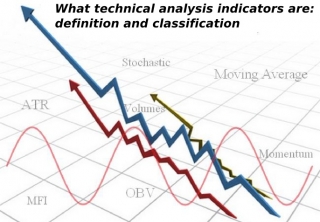
Whatever the skeptics say, technical analysis indicators today are an indispensable tool in the arsenal of many traders. Even such well-known speculators as Elder, Williams and Raschke used these algorithms in their work.
- Details
- Written by Admin
- Category: Forex indicators
- Hits: 6126
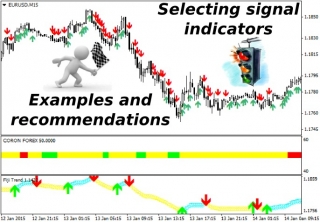
Signal indicators or "arrows", as they are disapprovingly called by the professionals, appear to be the simplest algorithms designed to identify specific entry points where you can buy or sell the asset in a timely manner.
- Details
- Written by Admin
- Category: Forex indicators
- Hits: 7355
No trading system is able to deliver only correct predictions, and failures are inevitable. If you mindlessly enter the market by all the signals provided, the efficiency of the trading system will decrease. This is why traders use various kinds of filters that allow avoiding "unreliable signals".
- Details
- Written by Admin
- Category: Forex indicators
- Hits: 19347
After determining the entry point, the next most important task is the constant monitoring of the results and profit/loss balance. Indicators of open positions display the settings and the current state of your already taken decisions (open) and trading intentions (pending orders) on the screen.
- Details
- Written by Admin
- Category: Forex indicators
- Hits: 13979
Most often, a good trend can be visually observed on the chart. But an experienced trader must clearly understand the current balance of forces in the market before entering. The trend strength indicators are the ones that help to assess the potential danger of market players: if you're not in the market – whether or not you should enter, if the transaction is in the work – the optimal point of closure.
- Details
- Written by Admin
- Category: Forex indicators
- Hits: 8969

In modern trading realities, there are quite a lot of various tools to predict market trends. Despite the fact that the determining factor in trading is money management, most of the players are constantly in search of the tools that can greatly simplify the trading process. In this article, we will focus on a whole class of analytic scripts. They are predictive indicators.
- Details
- Written by Admin
- Category: Forex indicators
- Hits: 10880
The ability to analyze the price movement on multiple timeframes has always been one of the conditions for success and a sign of a professional approach to business. Multiframe MTF indicators allow to display the characteristics of different periods on a single screen and effectively evaluate the whole picture of the market.
- Details
- Written by Admin
- Category: Forex indicators
- Hits: 18781
According to statistics, the price spends 70% of the market time in flat mode, while trading during the trend brings 70% of earnings. Various choices of flat indicators are designed for the correct identification of the weakly volatile areas of the market and help traders successfully enter the market at the beginning of a trend.
- Details
- Written by Admin
- Category: Forex indicators
- Hits: 8800
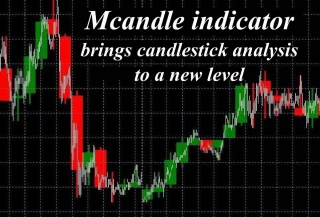
With any style of trading, it is recommended to start with the analysis from higher timeframes, as trade becomes more peaceful and profitable. But the standard features of the terminal do not give the opportunity to see how the events develop on different timeframes in one window, while the Mcandle indicator can.
- Details
- Written by Admin
- Category: Forex indicators
- Hits: 10961
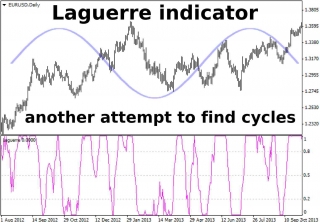
Laguerre indicator became widely known relatively recently – in the 2000s, after John Ehlers has published his book, “Cybernetic Analysis for Stocks and Futures”, where the author told the readers about this algorithm.
- Details
- Written by Admin
- Category: Forex indicators
- Hits: 14780
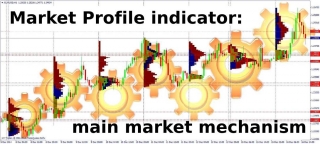
Behind any price movements in the financial market there is a human with their money, goals, and psychology. Trading volume is subject to the laws of statistics, and the Market Profile indicator displays a vivid picture of the market profile in the trading terminal, with the analysis of price and volume, operating on the market in real time.
- Details
- Written by Admin
- Category: Forex indicators
- Hits: 9894
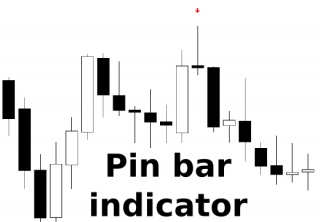
Many traders consider Pin Bar one of the most reliable patterns, which is used both as a fully autonomous strategy and in combination with other techniques, so do not be surprised at the appearance of the same name indicators.
- Details
- Written by Admin
- Category: Forex indicators
- Hits: 5578
Time is no less important than price for successful trading in a dynamic structure of Forex. Members of the Time indicators family deliver time characteristics to the price chart that are necessary for understanding of the market, a correct evaluation of the position and the choice of effective trading strategy.
- Details
- Written by Admin
- Category: Forex indicators
- Hits: 5698
The chart that any trader sees after the launch of the terminal is a battleground for bulls and bears, where each candle is hiding an intense struggle between the big players betting on the growth or fall. Bears indicator is an attempt to quantify the strength of the bears.
- Details
- Written by Admin
- Category: Forex indicators
- Hits: 27601
Trading within the range of volatility has always attracted traders, because most often simple tools are the most profitable. Super Signals Channel indicator is another version of the construction of the price channel, giving the signals of sufficiently high accuracy on any instruments and time periods.
- Details
- Written by Admin
- Category: Forex indicators
- Hits: 13464
Trading along the trend will always be the most reliable and profitable on any financial instrument. Searches for reliable trend signals led to the creation of the SuperTrend indicator – it allows you to properly "see" the mainstream, open the deal in time and work it out along the trend with maximum profit.
- Details
- Written by Admin
- Category: Forex indicators
- Hits: 11923
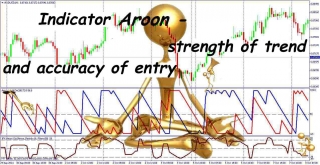
Solving the problem of determining the true reversal points and the correct direction of the trend is the key to successful trading on any instrument. The proposed version of Aroon indicator is an easy to use, anticipatory, and most importantly, effective tool to determine price extremes that gives fairly accurate signals to open positions.
- Details
- Written by Admin
- Category: Forex indicators
- Hits: 23390
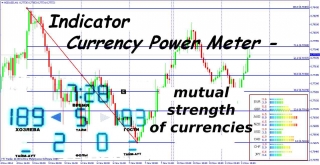
The strength of the financial instrument should be properly assessed in the current market situation for successful trading. Member of the family of the dashboards to assess the relative strength of currencies, the Currency Power Meter indicator will help traders who trade several instruments simultaneously.
- Details
- Written by Admin
- Category: Forex indicators
- Hits: 7855
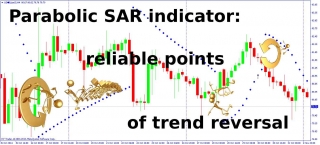
Fight with the effect of delay of technical indicators on the basis of moving averages has always been an urgent task. Parabolic SAR indicator has a mathematical model of a parabola in its structure, which reduces the delay on average volatility tools and allows you to catch the moments of a trend reversal.