

")
While on the subject of technical indicators, it is worth talking about an unusual tool for the market situation analysis, which is the AO indicator. AO stands for Awesome Oscillator. By the way, it was well-known Williams who created this indicator. This article will tell you what kind of a super indicator the AO is.
Traders who are just starting their acquaintance with the market often turn their attention to the AO indicator. And once you have traded with the use of this indicator, it becomes very difficult to abandon it. Many traders continue to use and upgrade it, find a combination of indicators, and build their own strategies on the basis of the AO indicator.
You can even meet online such description of this indicator as "magic". Let’s try to figure out what kind of magic can hide in such area as trading on Forex. Williams, the creator of the indicator, wrote in his book about the possibility to trade relying only on signals and movements of the AO indicator.
After taking a closer look at AO indicator, you will be amazed with its simplicity. The indicator consists of two smoothed moving averages (SMA). As you may have guessed, one MA is fast, while the other is slow. The period value for the fast MA is 5, and for the slow MA it is 34. Why such values? Williams claims that these values are determined by mathematical analysis using computer technology, and these figures are optimal for the market situation analysis. Next we see an interesting move: moving averages are drawn in the form of bar charts, which are most often used to determine the divergence and convergence, a strong technical signal.
These two averages are displayed as a bar chart, which allows you to see the divergence in the chart.
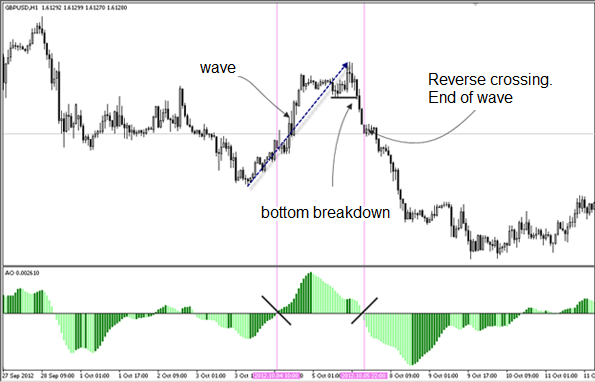
As you have already understood, the basis of the indicator is the two moving averages, which actually allow a trader to see wave intervals in the market for a particular trading interval. Call to action is the crossing of these averages and zero mark in the AO indicator window. By the way, if you lost your moving averages, don’t worry – they are displayed in another window (the indicators window), so as not to clutter up the price chart and allow a trader clearly see the dynamics of exchange rates movements. On the practical side, the indicator’s strength is the display of market conditions with waves, whether it is a trend or correction. The waves mean three-stage rates movements.
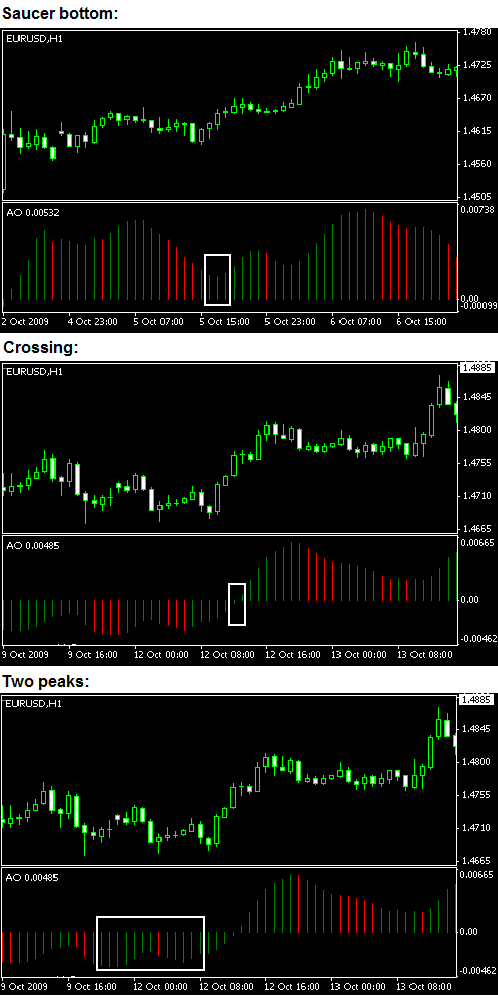
The main task of a trader is to monitor these waves and come into play after one wave ends and the new one begins. Using AO indicator, you should analyze several time intervals at once, at least in the moments when the bar charts are close to zero mark. AO indicator also has standard shapes that give a signal to buy or sell – a “saucer bottom”, a crossing of the zero line, and two peaks. The image below illustrates these combinations.
 As a result, we have a really magic indicator. Regardless of your trading strategy and method of analysis the indicator will be very useful. Are you looking for waves? – Here you go! Do you like trading patterns? – Go ahead!