

")
Solving the problem of determining the true reversal points and the correct direction of the trend is the key to successful trading on any instrument. The proposed version of Aroon indicator is an easy to use, anticipatory, and most importantly, effective tool to determine price extremes that gives fairly accurate signals to open positions.
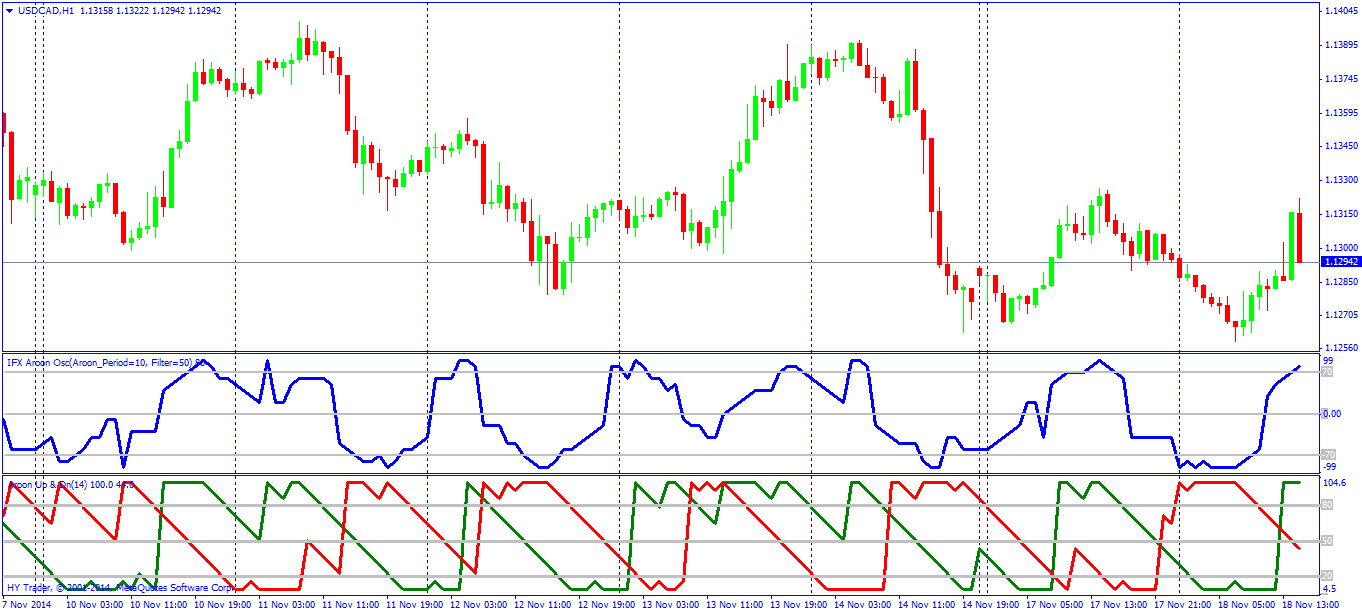
Custom mechanism has been developed to accurately determine the direction of the market and its ability to reverse. Even minor price fluctuations and strengthening/weakening of tendency within the time period does not escape the attention – the Aroon indicator reflects all the basic market conditions: upward and downward movement, trend fracture, gaps and consolidation (flat). There are two modifications – in the form of a conventional chart indicator and in the form of an oscillator, which displays the difference between the two baselines.
Setting, parameters and mathematics of the indicator
The Aroon indicator is set in the section “Custom Indicators” of MetaTrader4(5) in the usual way, is located in a separate window, and internal parameters are configured to operate:
- AroonPeriod – calculated value with N periods (in bars) to compute the max (the highest) and min (lowest) price values on the current chart (default is 14).
- MailAlert/SoundAlert – visual/audio signals for the visibility of the display (default is disabled (false).
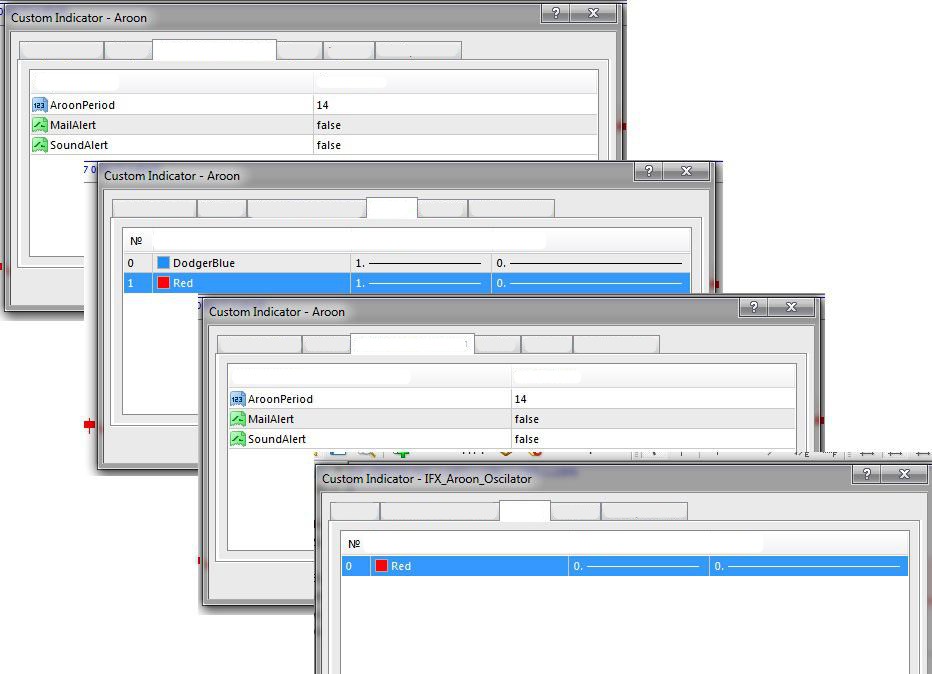
Visually, the Aroon indicator consists of two intersecting lines:
Lower Aroon or AroonDown (Red) is time (in periods) elapsed since the introduction of the latest low. The value is calculated from the current period: Adown =((n-h)/n)*100, where n is indicator period, h is number of days after the low in the current period. For example, if the last extreme was today, AroonDown =100.
Upper Aroon or AroonUp (Blue or Green) is time (in periods) since the introduction of the last price peak. It is calculated as relative to the current period, but you should take the number of days that have elapsed from the moment of the absolute high: Aup =((n-h)/n)*100, where n is the indicator period, h is the number of days after the maximum in the current period. For example, if the last max happened today, AroonUp =100.
Oscillator Aroon should be noted separately: it is calculated as Aup- Adown and its values are ranging from -100 to +100.
The boundaries between 0 and 100 are set as traditional for overbought/oversold 20/80 or 30/70. Level 50 is additionally marked.
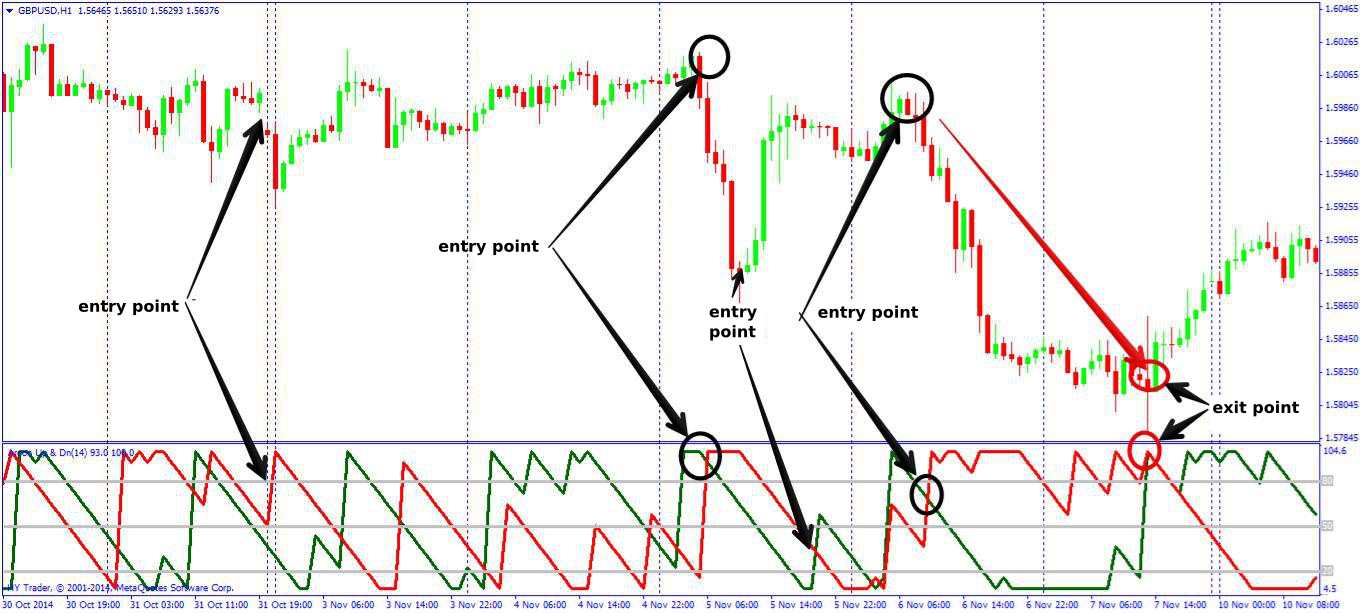
The main types of trading signals of the Aroon indicator
First: Signals that reflect only the extreme price values. In this case, the indicator lines will be located in the opposite (upper and lower) ranges of the terminal, which means the bullish or bearish trend. The downward motion is considered preferable, if the blue (or green) line is below 30%, and the red is above 70%; downward movement – accordingly, if the blue (or green) line goes above 70%, and red falls below 30%.
Important: if the AroonUp (or AroonDown) lines cross the 50% level, the trend change or fracture is expected.
Second. The situation of parallel lines movement relative to each other indicates a strong current trend (i.e. it is not necessary to wait for a reversal).

Third. The overlapping lines are typical for medium-term or long-term trend, are the result of “lifting” the AroonDown or “fall” of AroonUp and signal the emergence of a growing or downtrend, respectively.
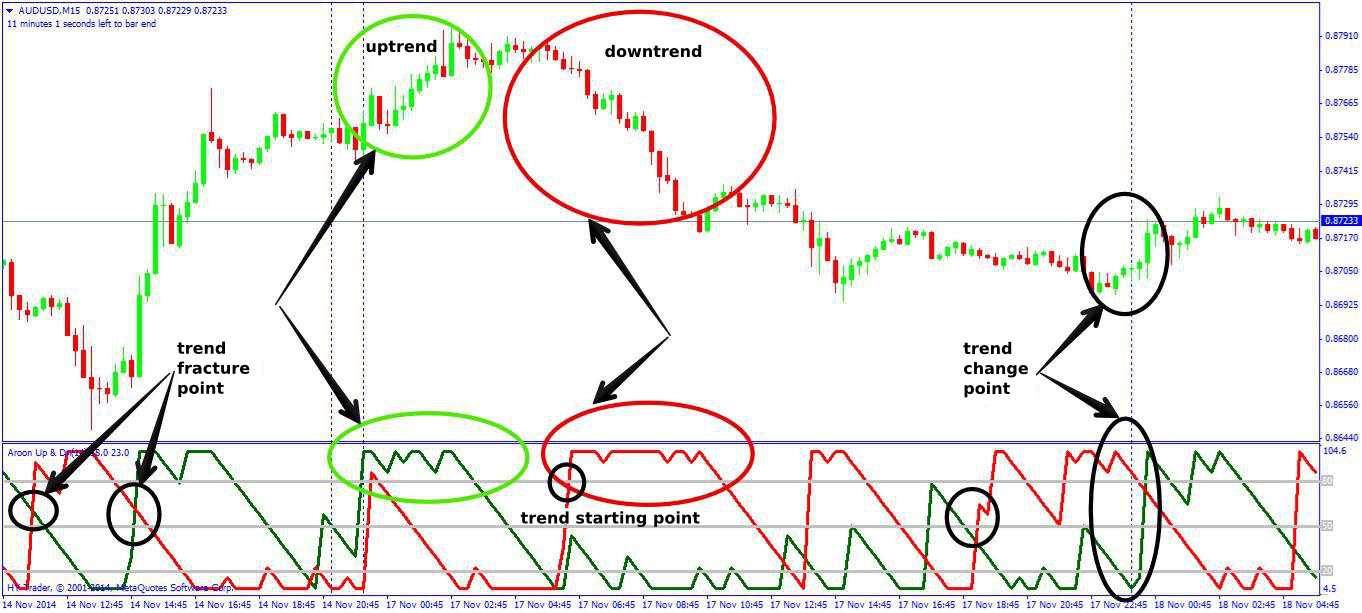
Important: you need to open new positions only at the intersection of the red/blue lines in the range between 30 and 70 levels.
Tushar Chande, the developer of the Aroon indicator, simplistically interpreted the emerging signals as follows:
- if Aroons (upper and lower) are approximately the same line, there is no trend in the market (sideways);
- if one Aroon (upper or lower) goes over the line 50, the current trend (upward or downward) weakens (expires);
- if one of the Aroon lines goes beyond 30/70 (or 20/80), the current trend continues and is gaining momentum.
- if the oscillator line has broken the zero level upwards, there’s high possibility of upward movement;
- if the oscillator passes the zero level downwards, the market will likely fall.
The oscillator line depends on the relative position of the Aroons, so it is the oscillator that can reliably determine whether there is a trend on the market and how strong it is: the higher or lower the line of the indicator relative to the zero (center) line, the stronger the current trend, if the oscillator line lies on zero, there is no trend on the market (flat).
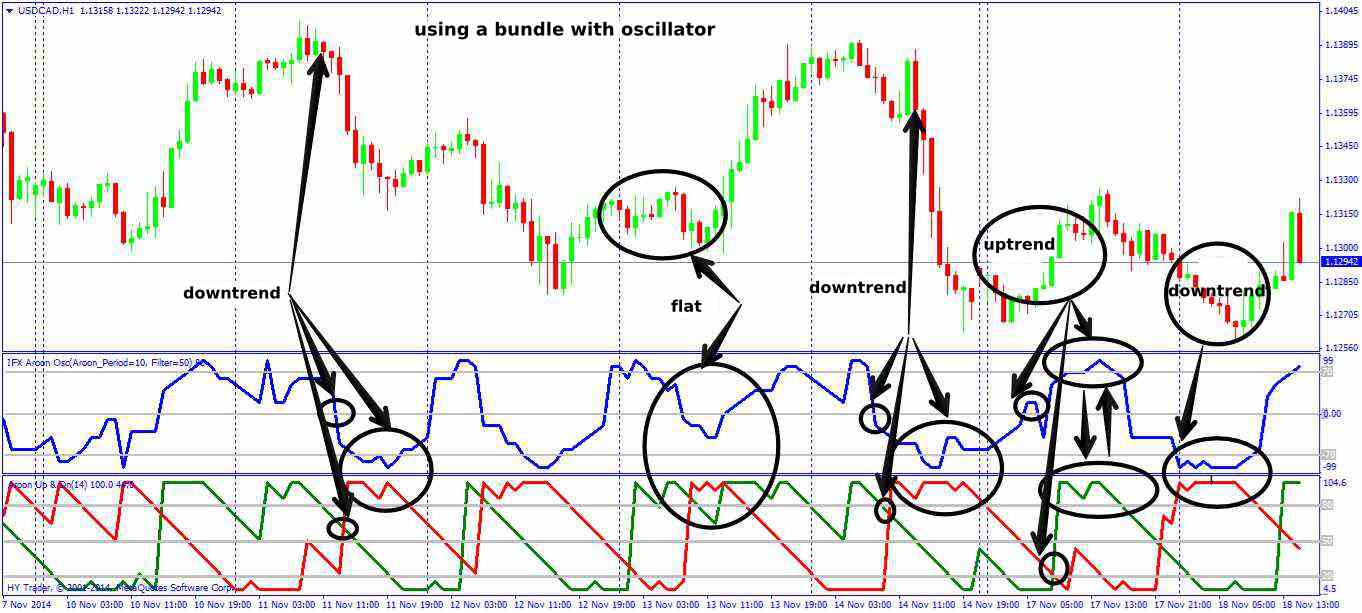
Important: we recommend combining Aroon Indicator with Aroon Oscillator, as the oscillator produces fewer but more accurate signal, and the usual indicator allows you to plan long-term actions.
The parameters of the bundle indicator+oscillator may be the same, but in fact they should complement each other and should be selected for a specific tool. If the signals of the indicator diverge, you will likely need to specify the parameters of the trend indicator: increase in the period will make it more accurate. To improve the accuracy of the oscillator, it is recommended to make its period shorter.
The optimum time to close positions:
- when AroonUp reaches the top, and AroonDown – the lower limit of the indicator,
- the second intersection of the two curves occurs, but in the opposite direction.
Important: when you close at the latest version, if additional indicators show stable movement, the open position can be hold long using a trailing stop.
And as a conclusion...
Positive moments while using the Aroon indicator:
- Reliability – indicator causes almost no false alarms;
- Accuracy –not only shows the direction/strength of the trend, but also very accurately assesses the possibility of a reversal (whether it is a pause or a change of the trend).
- Stability and ease of management.
- Unique graphical interpretation of indicator readings.
The disadvantages of the indicator are:
- Delay of the graphical display of the "sharp" speculative price movements of the positions – the problem is solved by using it bundled with additional indicators.
- Expected profit when using the Aroon indicator (on average) is only 5.5% higher than the result from the usual tactic of "Open and hold".
Information about the presence of a trend and its strength always gives the trader the opportunity to make the right trading decision: to hold the position based on the preservation of a trend or not to open a position, if the future direction of the movement is unlikely. In this regard, the use of the family of Aroon indicators will be useful both for professionals and beginners.
Social button for Joomla