

")
The chart that any trader sees after the launch of the terminal is a battleground for bulls and bears, where each candle is hiding an intense struggle between the big players betting on the growth or fall. Bears indicator is an attempt to quantify the strength of the bears.
As a rule, this indicator is used in trading in conjunction with the Bulls indicator, evaluating the strength of the bulls. Correct interpretation of signals allows to follow the trend and close positions immediately prior to its completion or the beginning of correction. It is advisable to use the Bear indicator with instruments of the trend group, such as the moving average.
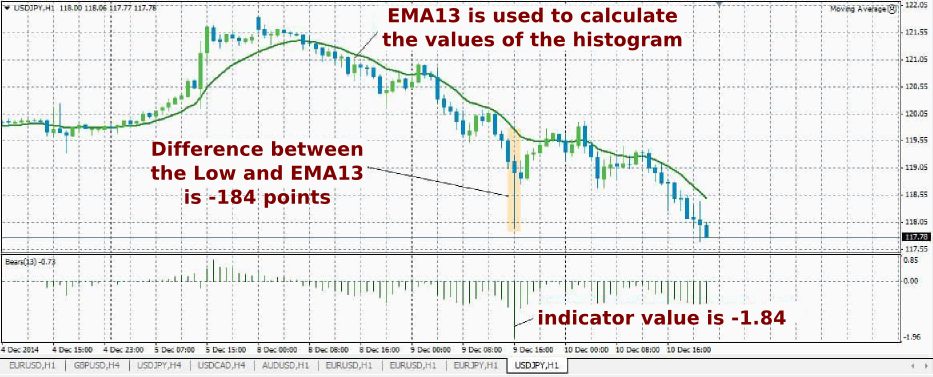
On the chart, the strength of the bears is presented as a histogram, each bar of which is calculated as the difference between the Low (minimum price of the corresponding candle) and the value of EMA (period is specified in the settings of the indicator). The difference in the histogram is calculated in points, then the result is divided by 100. This confuses some traders – for example, the difference in points on the chart exceeds 200, while the indicator value is equal to 2.
The success of the use of the indicator depends on the ability to "read" its readings, you should take into account the position of bars relative to the zero line, the bar size and divergence – this is a rather strong signal. At that, the received signal needs confirmation.
Bears indicator: rules of interpreting the readings
You should remember the following:
- if the bars of the histogram are less than zero, it means that the market is bearish. In this case, the moving average (with a period of 13 by default) is above the price, so the difference L – EMA will always be a negative number;
- if the market is bullish, the picture is the opposite – the EMA will be below the price chart, and bars of the diagram – above the zero line.
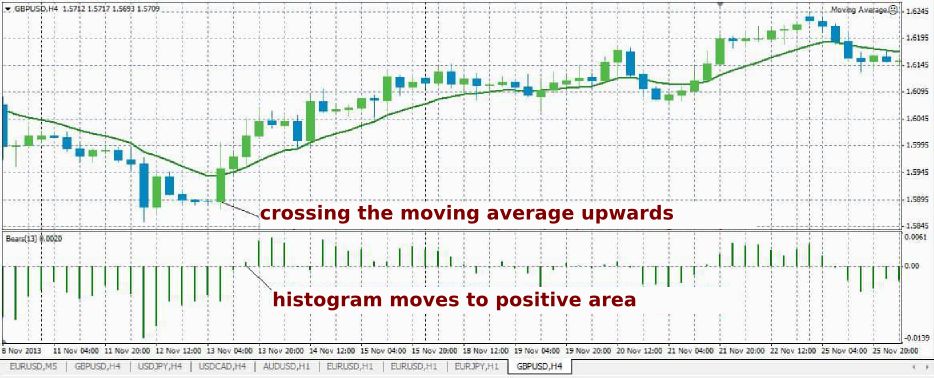
Actually, the indicator of the bearish strength can be used in any trading system as a supplement. The simplest option is the combined use of MA and Bears indicator. In this case, the optimal signal to buy will be the growth of the bearish indicator in the negative area and reversal of the moving average upwards.
Growth of the indicator shows that the distance between the Low and 13-period EMA decreases, i.e. the extreme is reached and a gradual growth begins. Growth of the MA confirms the received signal. Do not try to buy when the indicator is in the negative area and its values decrease. When the value of the indicator approaches to zero, the price is approaching the 13-period EMA, which often acts as a support/resistance, so you need to move SL to breakeven.
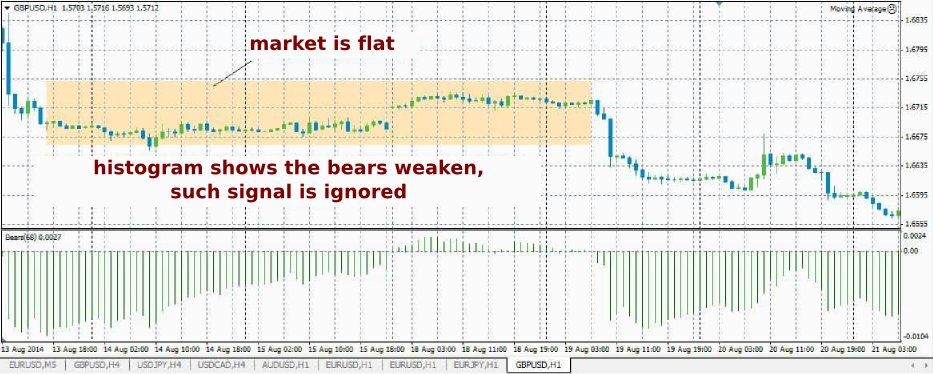
The rules for the deals to sell are the opposite. We can complement the above signals with the divergences and histogram intersection with the zero level – they work out on the Bears indicator in most cases. It is better not to trade during the flat, as in such a situation the Bears indicator gives many false alarms, and its values fluctuate around zero.
Possible indicator signals
Divergence on the chart is uncommon, but is almost always a harbinger of a strong movement. Divergence must be sought only in the areas of the histogram below the zero line.
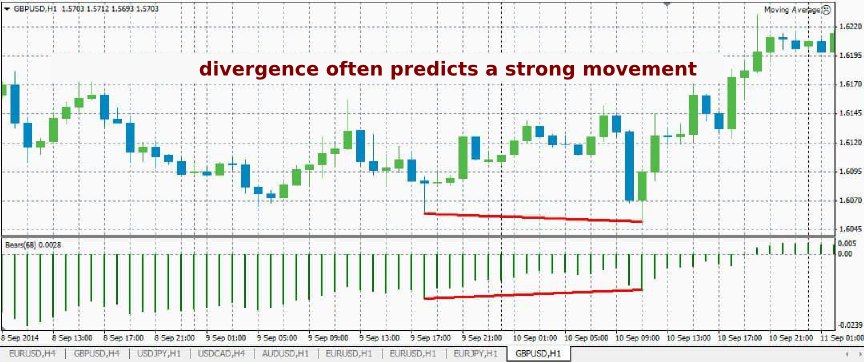
Then histogram enters the negative area, and you can capture a moment of exiting the flat. If the price has for some time traded in a horizontal channel, then moved to negative area, and the values of the histogram gradually decrease, then the bears are most likely strong and downward movement will continue.
On large timeframes (h4 and above), the Bears indicator gives a signal with some delay. Therefore, you should focus on trend indicators, and take the move of the histogram to the positive area as confirmation for entry.
Example of the trading system with Bears indicator
"Bears strength" can be used in almost any trading strategy. As an example, you can choose an Elder’s “X-Ray” strategy. It uses Bears, Bulls and MA indicators. Elder used EMA (34), settings for Bears and Bulls were equal to 68 and 164 respectively.
When you create the system from scratch, the basic problem is the selection of optimal parameters. The Bears indicator with a default value of 13 is not always suitable. If you trade on small timeframes, you need to increase the number of candles that will be taken into account in the analysis of the indicator.
In our strategy, the EMA, which is used to identify a trend, is twice faster than that used in the Bears indicator. The main signal to buy is a breakthrough of the candle on h1 by EMA34 upwards. In this case, you need to have the bars of the histogram below zero mark and increasing.

The signal is opposite for a deal to sell – you need to wait for the breakthrough of EMA34 downwards, with the bars of the Bulls histogram being over zero and decreasing. Thanks to this approach, you can often catch a good movement. Exit from the transaction is carried out either by the opposite signal, or by TP.
Summing-up
The Bears indicator is quite simple, but it does not reduce its effectiveness. Using the difference between the extreme and average price value turned out to be a pretty accurate way to assess the strength of the bidders.
However, by itself, this tool cannot be used for trading. The optimal option is when it is used as an addition to already operating trading strategy or in conjunction with the indicator of the trend group. One of the best combinations is using MA (to determine the trend and its change) and the "Bear strength" indicator to confirm the entry.
We should also mention the sensitivity of the indicator to the selected period. This indicator is responsible for the number of candles that is taken into account when calculating the value of the histogram, so quite different results can be obtained on the same timeframe. Period will have to be manually selected for the chosen timeframe and specific currency pair.
Social button for Joomla