

")
 A trading system based on the principle of divergence and convergence is the main basic element of technical analysis among the many basic approaches in online trading. Of course, if you search in the archives of the indicators, you can be found many instruments of such kind. The divergence indicator is indeed the fundamental indicator of the trading strategy, which does not dependent on the time interval. However, you should know the most common indicators of such trading systems.
The MACD indicator. This indicator enable traders to work at any time interval, with the use of the divergence principle. If you look at the picture, which is shown below, you can clearly see how this indicator works.
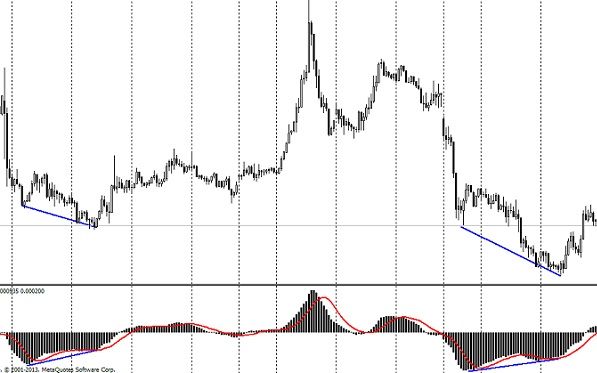
If the lines of the price lows and lines of the indicator MACD become narrower, the moment for opening a buy order will occur. You should bear in mind that the more narrowing and interval is, the greater the subsequent motion will be.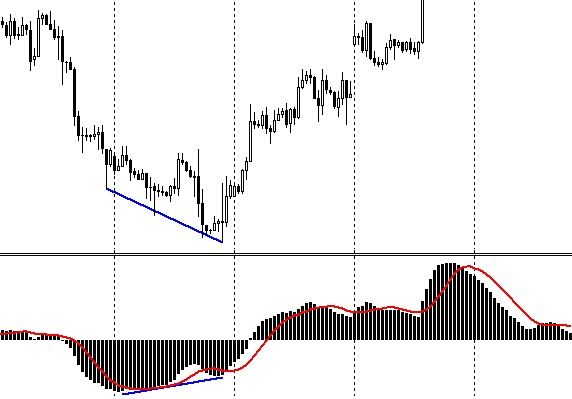
This divergence indicator shows that the order should be opened when the subsequent confirmation of the price movement on the chart occur, in the form of candlestick combination or by signals of another indicator.
In addition to the MACD, the Commodity Channel Index can be taken as instruments of divergence and convergence. As a rule, this indicator shows the overbought and oversold zone, but every experienced trader knows that the CCI is also an indicator of divergence. Many professional traders use it as a basis for their trading strategy.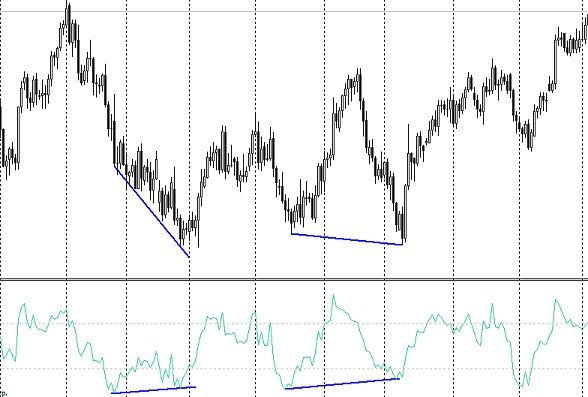
The image clearly shows how the divergence indicator CCI fulfills divergence. It should be noted that you should open buy order after the oversold line is broken trough. You should make a decision to close the transaction, according to the price movement to heights, which were achieved during last periods.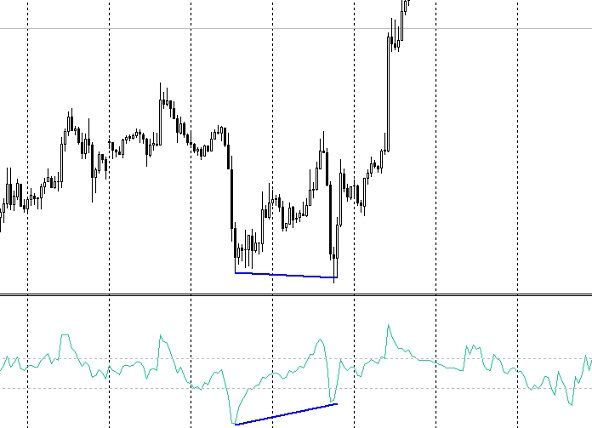
The images above show divergence signals of the CCI indicator.
But this is not the only indicator of the divergence that works in a similar manner. If you use this kind of signal, certainly you should know the RSI indicator. That is the Relative Strength Index. The indicator is one of the most common tools that can be used in the trading strategy as a source of signals of divergence and convergence.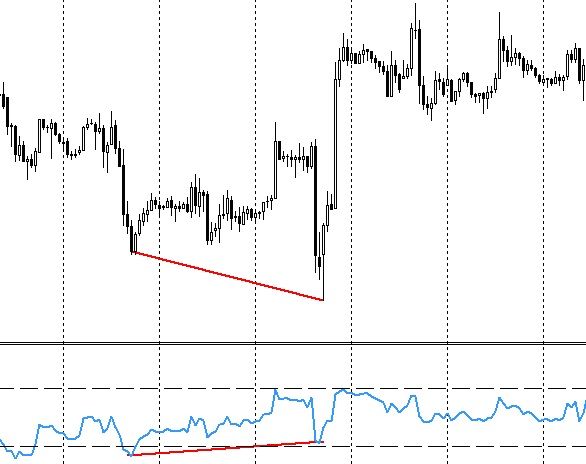
As the image shows, the Relative Strength Index indicator reflects the convergence of lows and the indicator line on the chart, nearby the oversold zone. In such situation the trader should wait for the moment to open a buy order.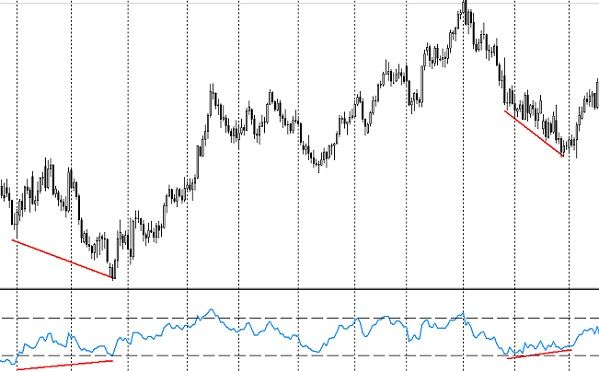
Of course, the experienced trader will immediately notice some similarities with the Commodity Channel Indicator. However, it is not true. The Commodity Channel Index has less fluctuation. And with higher parameters (here we use parameter -14) it becomes less seen. Therefore, any indicator that is designed to work with the divergence should be tested manually.
In conclusion, it should be noted that any of three indicators mentioned above operates as the divergence indicator, when it is used with any other instrument of technical analysis. But even being used only one time, the method of divergence and convergence can bring trader stable profit from the online trading, especially if you consider the fact that when you wait for the divergence, you can use only one indicator and only one signal. Frequency of its occurrence is directly proportional to a positive transaction.
Social button for Joomla