

")
Traders began using the term "pattern" back in the 20th century, even before the advent of computers, so the classics and their followers had to draw all the models manually. Nowadays computers allow automating many operations, and search for market patterns is no exception, so every popular market model has got its own Forex pattern indicator.
It should be noted that many beginners don’t understand the proper meaning of the word “pattern”, thinking only of candlestick combination. But in fact, it covers any repetitive formation in the market which can be treated as a signal by means of technical analysis, so candlestick patterns are only a special case. By the way, below you can find an example of such an indicator called Pattern Alert:
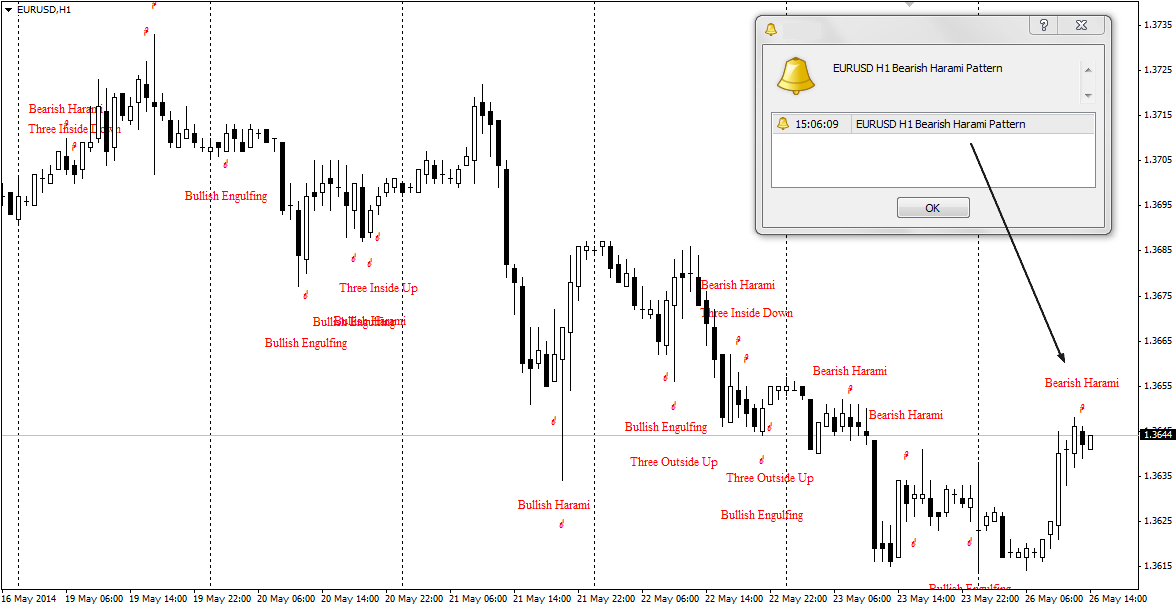
Forex pattern indicator built on similar methods has several advantages: first of all, it is the absence of a subjective view of the situation, secondly, the presence of an audio signal allows to reduce time spent on trading, and thirdly, you can regulate which patterns to display on the chart and which to ignore. In the illustrated example, the indicator saw a formation of the "Bearish Harami".
There are also obvious drawbacks, the main of which is the large number of false alarms. To be fair, it should be noted that the reason for this phenomenon is not the indicator, but rather the method used as the basis, because candlestick patterns need confirmation – for example, the presence of a strong price area nearby.
Efficient Forex pattern indicator
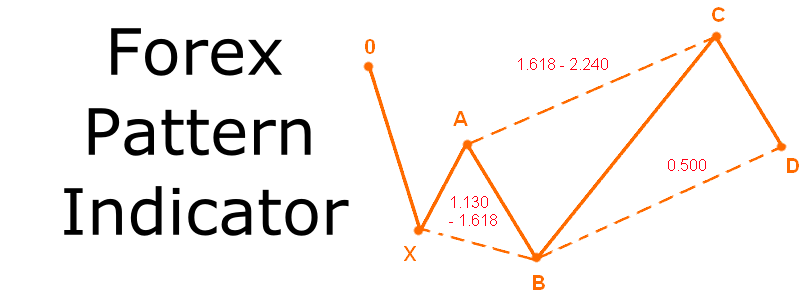
It is known that the efficiency of the indicator is determined by the ability to carry out complex calculations in seconds and to present the results on a chart in the most condensed form, otherwise there’s no sense to use it. One of such algorithms is ZUP indicator, which displays Gartley and Pesavento patterns on the chart. The following image shows the situation with the GBP/USD pair:
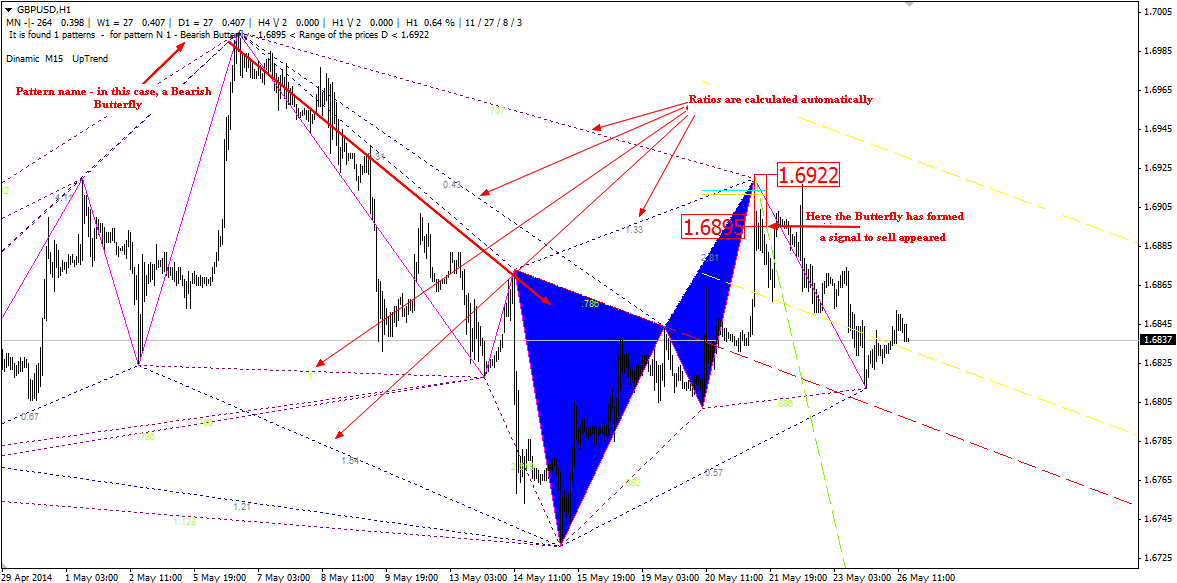
It is impractical to study the theory in detail, so we’ll just note that the model is built on Fibonacci ratios, and their manual marking and calculation would require a lot of time. In our opinion, the ZUP of version 88 or younger has no drawbacks, and the strengths of this indicator are briefly listed below:
- if you don’t consider major targets, the probability of working the patterns out is very high;
- you can set the allowed price slippage for patterns search (in other words – rounding) via the ExtDeltaGartley variable;
- authors provided the most detailed instructions for each parameter directly in the code , which can be read directly in MetaEditor;
- the indicator marks out the area after which the signal becomes irrelevant on its own, so there are no problems with a stop-loss.
Forex pattern indicator built on divergence
Patterns of divergence on the MACD should be allocated to a separate group, because despite the relatively poor quality signals and weak theoretical basis, they are still popular among traders. Let’s consider PatternMACD indicator as an example of such systems.

As you can see in the working window, the algorithm analyzes the sequence of fractals, compares them with the price dynamics and generates a signal to buy or sell if the corresponding divergence has formed. In general, it’s hard to work using this technique, because use of fractals reduces the likelihood of false alarms, but the timeframe must be at least 1-day.
In conclusion, we should note that the Forex pattern indicator differs from most of its counterparts by the fact that it doesn’t generate signals on its own formulas, nor it adapts to the market, but rather only automates the part of work traders had to do themselves before – this can be called a kind of information support.