

")
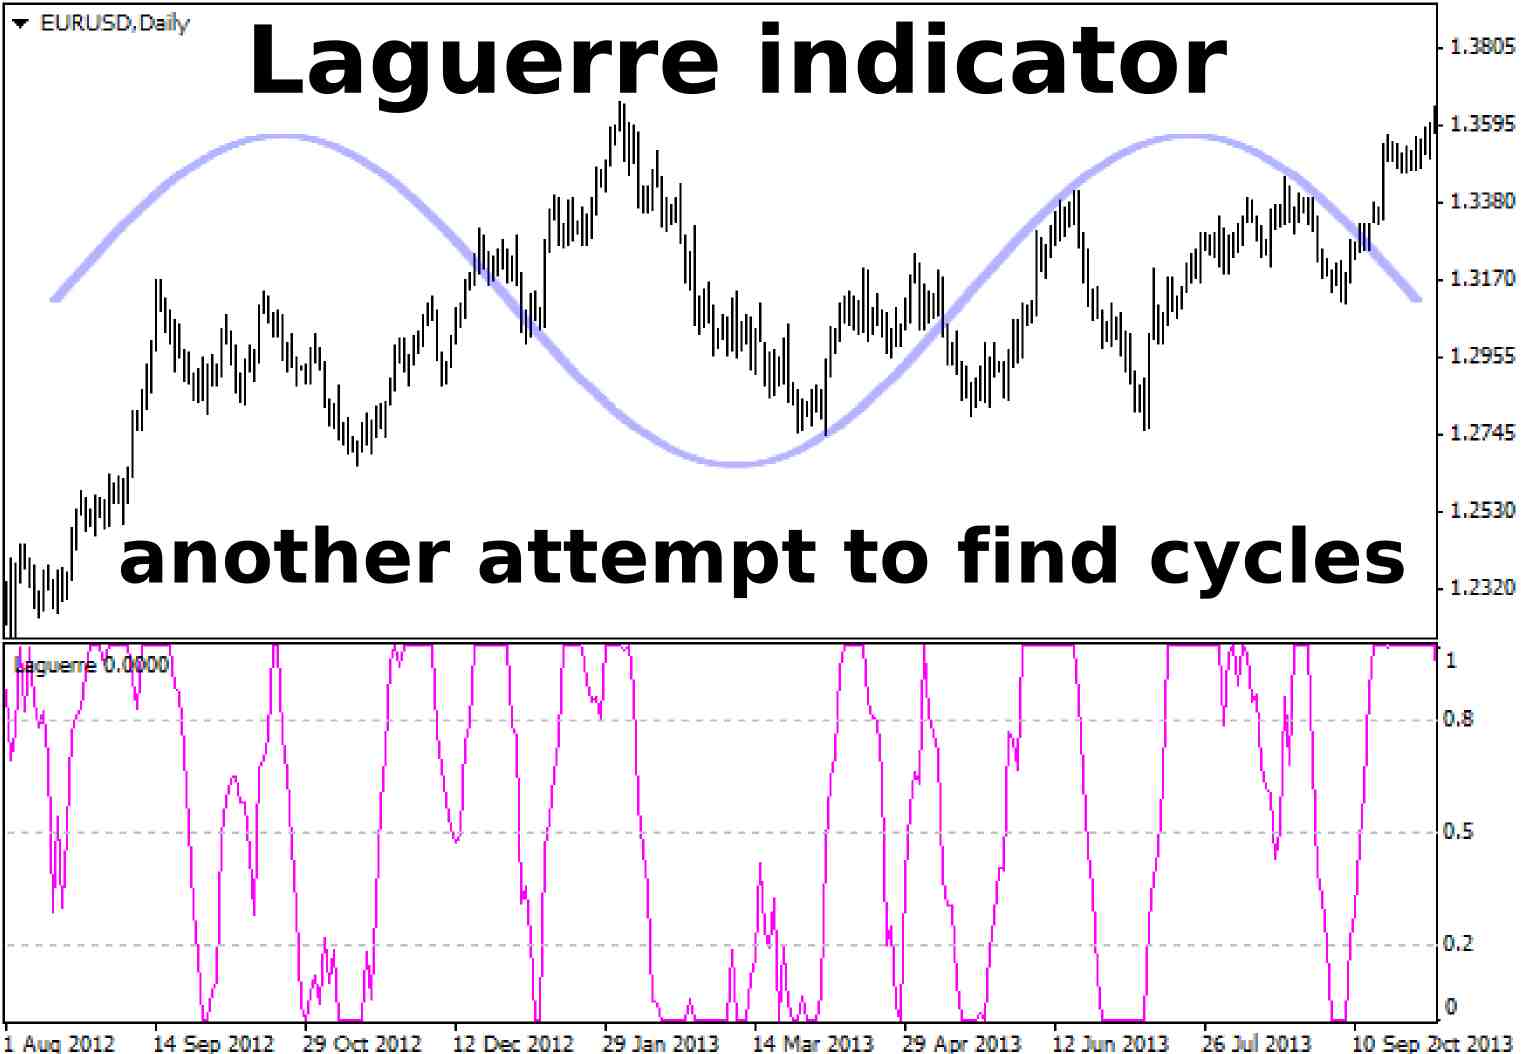
Laguerre indicator became widely known relatively recently – in the 2000s, after John Ehlers has published his book, “Cybernetic Analysis for Stocks and Futures”, where the author told the readers about this algorithm.
Before proceeding to the description of parameters and practical examples, I would like to say a few words about Ehlers. Unlike many contemporary authors and teachers, John had an engineering education and worked with equipment designed for the processing of space signals in the 70s of the last century, which served as a starting point for further research and developments.
It is not hard to guess that the central element of the Ehlers’ theory is "cycles", or to be more precise, John used "spectral analysis" – not a classic one, but that of "maximum entropy", previously developed by geophysicists. If we do not delve into science, a brief sense of such studies is reduced to the estimation of future spectrum on the basis of a minimum set of data available to researchers.
And where is the problem most acute? Of course, at the financial markets, so Ehlers attempted to apply his experience to create models that can "predict" the behavior of prices. And in fairness, we should note that John progressed quite well in his research, but he noted that suitable cycles in the market (or rather their working out) are observed only for 15% of total trading time, so any cyclic, spectral and other similar models need to be combined with trendy tools. By the way, such a remark will be handy for us as traders.
Configuring the Laguerre indicator
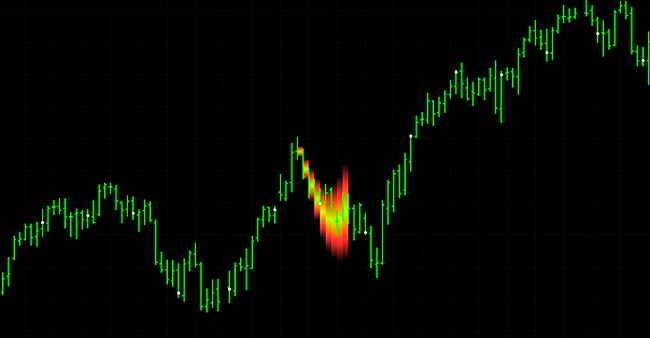
In fact, this algorithm is one of the easiest tools developed by Ehlers. Again, we’ll take our mind off things for a bit: if you visit the author's site, you will find a lot of interesting developments, including advancing indicators for MetaTrader – for example, the figure below shows one such instance:
Therefore, the Laguerre indicator is reasonable to be used in conjunction with other Ehlers’ developments, but it's a separate topic, and now we go back to the parameters. At its core, this tool is a modification of RSI, it is even called like that in the original: RSI Laguerre, therefore, like most of oscillators, its final value after the transformation will always be within certain limits – in this case, this is the interval from 0 to 1 inclusive.
As for the settings, the user can only change the number of bars to display historical values, as well as gamma parameter, which defaults to 0.7 and, in fact, describes the period. The figure below shows the indicator itself and the formula for its calculation:
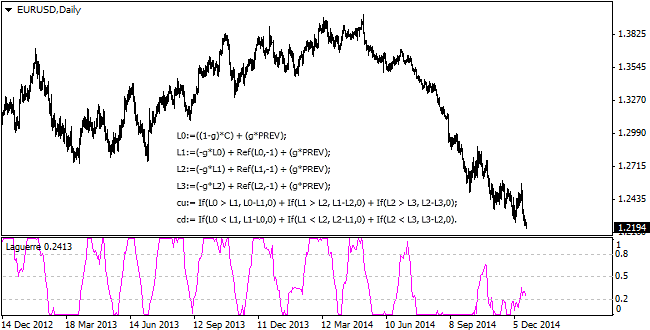
Many traders believe that the “CountBars” parameter (hereinafter CB) does not affect the result of the calculation and is intended only to display the history: this assumption is false, because if we compare the two indicators in the same window (one CB=100, and the second CB=30), we obtain a different result:
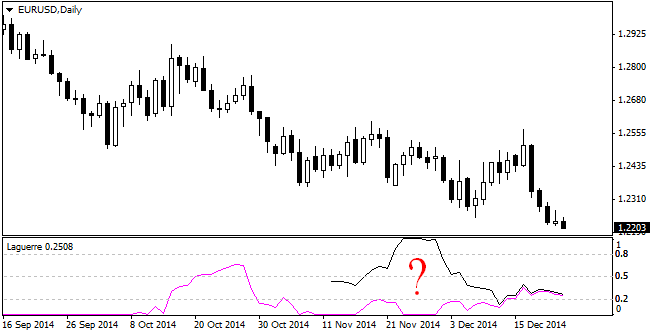
Of course, this is a bug in the code, so you should choose the version of the algorithm where you can’t change this variable, or those options where the values are the same at different depths of history. Such inconsequential (as it may seem) error can lead to a loss of time and money.
Laguerre indicator as a standalone trading strategy
We noted above that the expert considered today can be optimally combined with other techniques and methods (and we shall return to this subject today), but if you trade on large timeframes, we can use only the Ehlers’ development: to do so, we just need to install two indicators with different gammas on the same chart:
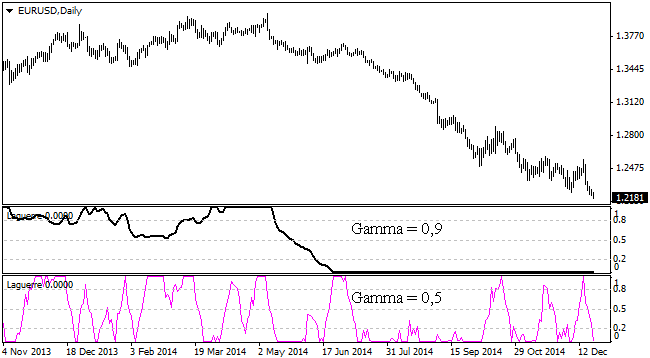
The first of them (with large period) becomes the identifier of the global trend, i.e. if the signal line is directed downward, the market is bearish, if upward – bullish, and if the values "got stuck" at the border, you should take into account the event prior to this movement, for example:
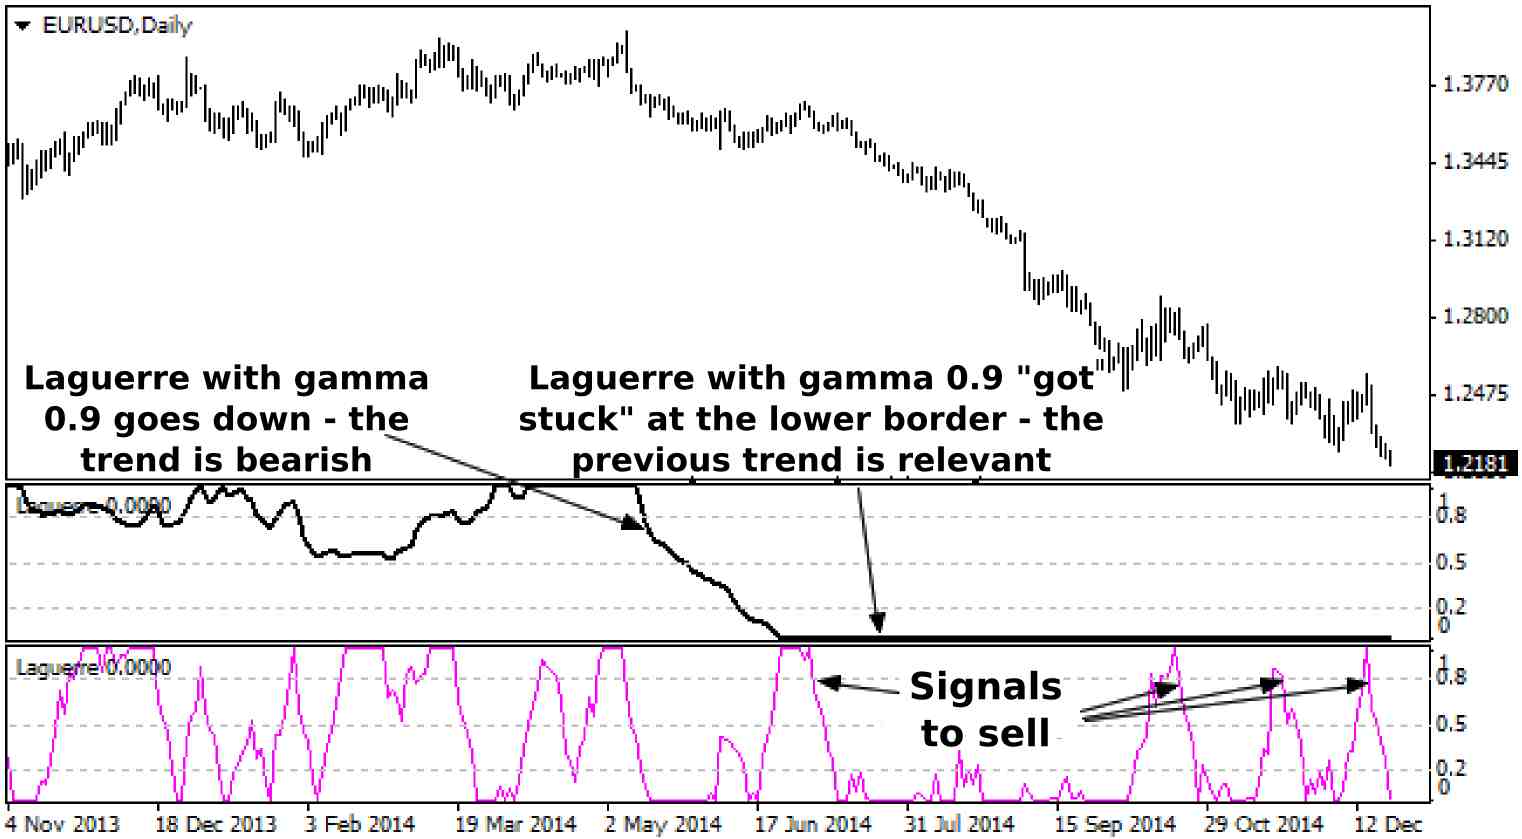
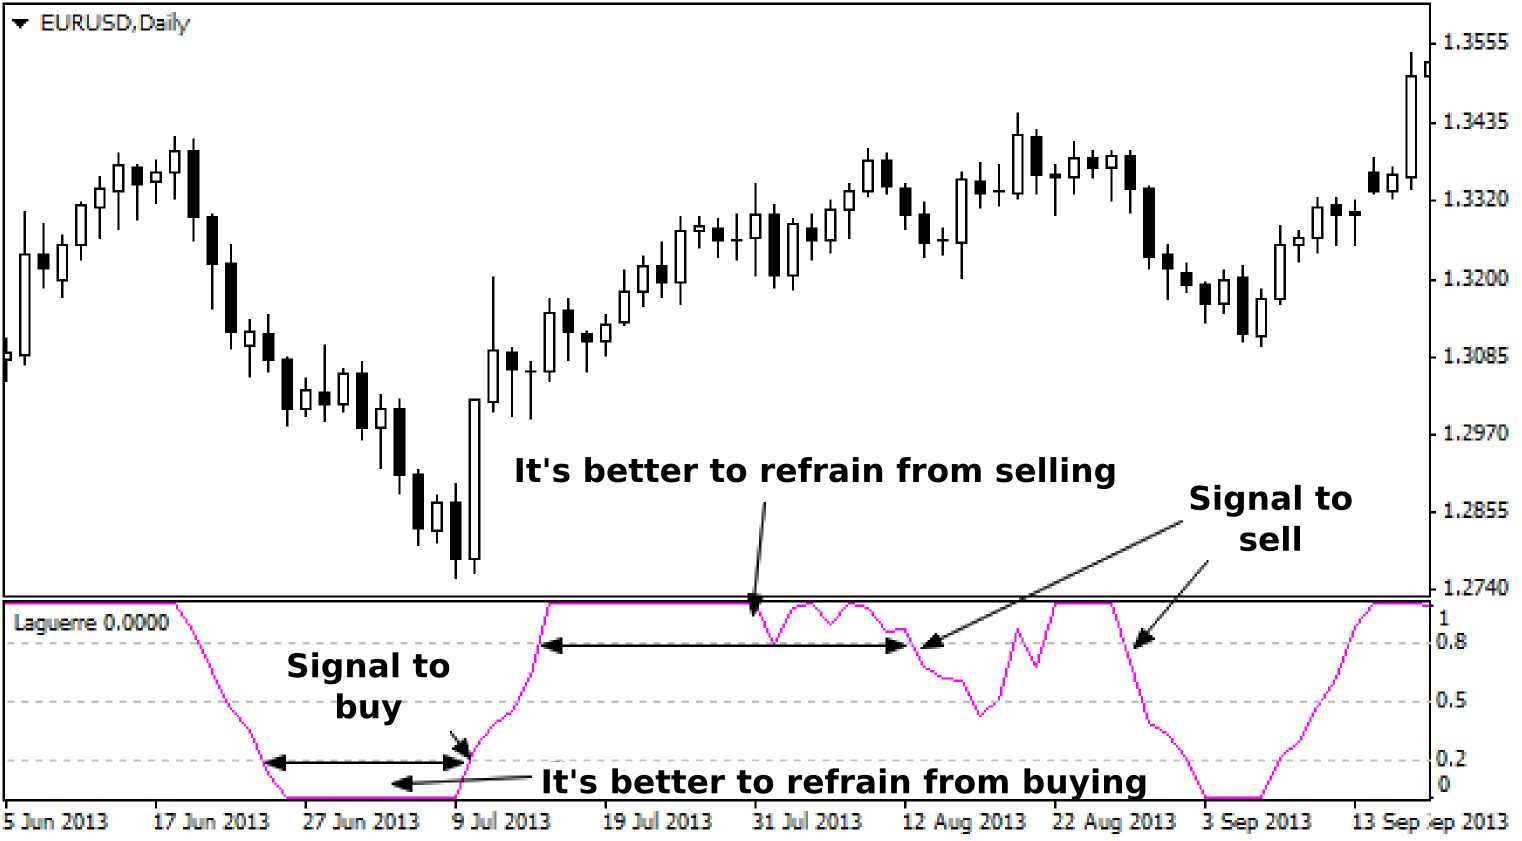
The second expert (located in the lower window) is used, as you might guess, to determine the optimal entry points in the direction of the trend. Speaking of points of entry, in the "classical" way (the authors' methodology), the Laguerre indicator generates the following signals:
- If the signal line crosses the horizontal level of 0.15 upward – it's time to buy an asset;
- If the indicator crosses the level 0.85 downward – it is a signal to sell;
- If the line is clamped between the extreme value and the key level, you should refrain from entering into transactions.
Laguerre indicator in conjunction with other methods
We remind that John Ehlers himself noted that the cycles in financial markets should be combined with trendy techniques, and it is difficult to argue, because unlike physical processes, the behavior of speculators and investors is not always rational – unfortunately, this is what the modern market is.
The question remains of what kind of analysis or indicator should be chosen as additional? In our opinion, you can experiment here, as both classics of technical analysis (trend lines, channels, etc.), and the basic trend indicators show good results (but only if a trader or analyst has mastered them perfectly). We can bring a strategy where the Laguerre indicator is combined with a simple moving average as an example:
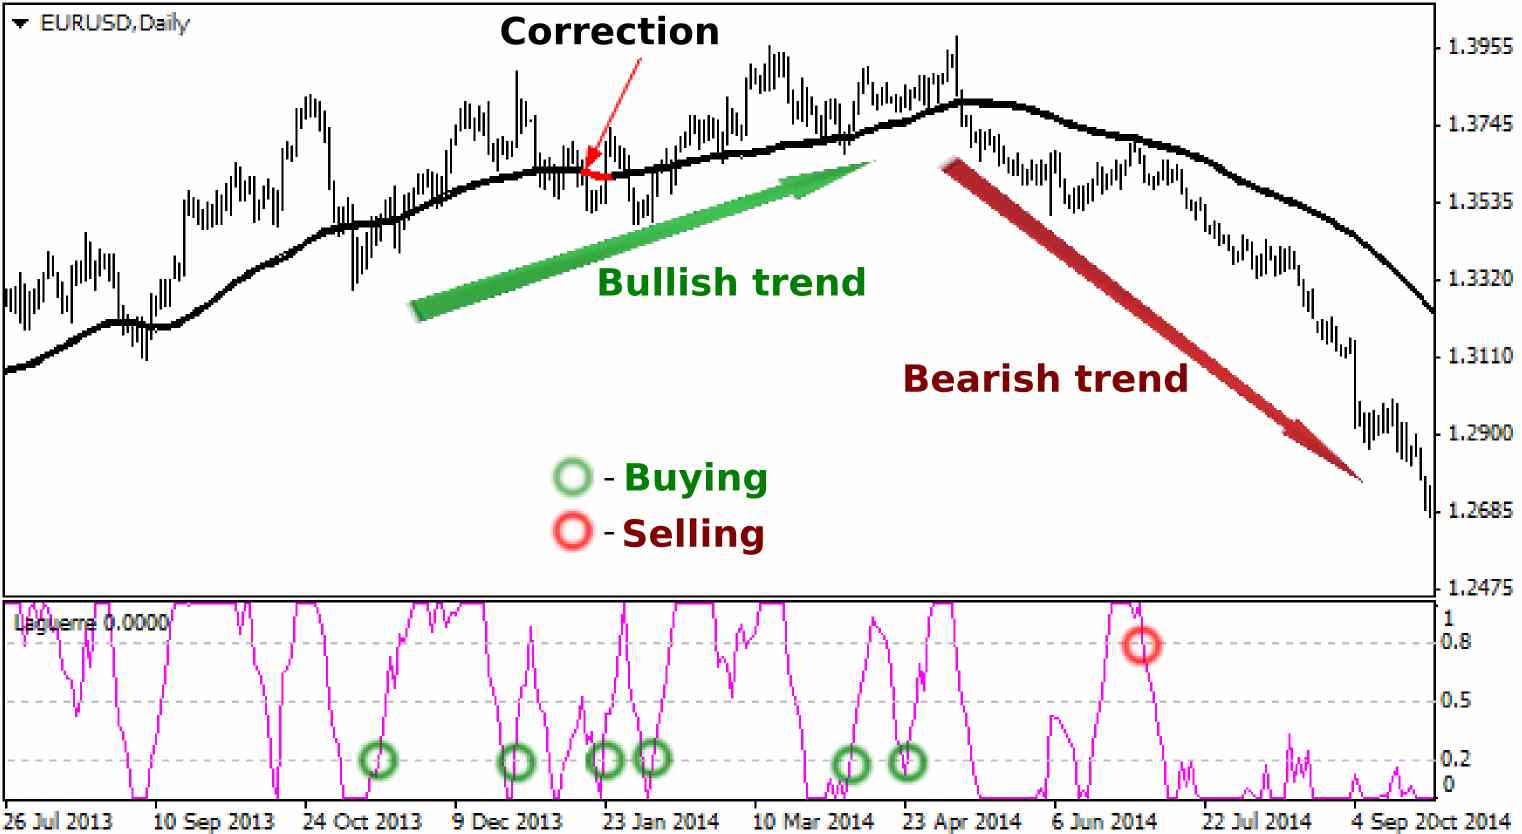
The problem is only in the optimization of the gamma index in such a way that the number of true signals exceeded the number of false, and all the rest, including the calculation of the optimal value of stop-loss, as they say, is paperwork.
In addition, since we are talking about the indicator similar to conventional RSI, interesting results can be obtained if we apply the standard deviation to it, a faithful interpretation of the values of which will allow to avoid some dangerous situations. In fact, the debate on this topic can be very long.
Strengths and weaknesses of the considered indicator
If we briefly sum up the above, it is impossible to miss the important fact: the Laguerre indicator generates signals more often and more accurately than most oscillators, while the number of false alarms that either trigger stops or force to close a deal ahead of time is significantly lower than that of the popular stochastic oscillator.
On the other hand, the developer is not able to eliminate the most important problem that significantly affects the results of almost all indicator systems: the signals are still lagging behind. Of course, you may choose not to wait for the signal line to leave the overbought/oversold areas and open orders at the first touch of the levels, but in this case the number of false patterns will increase many times and can bring the expectation of any strategy to a negative value.