

")
 This article describes a fairly widespread instrument of technical analysis which probably has become the classic instrument. Nowadays one can hardly meet a trader who is not familiar with such oscillator, as the RSI indicator. This abbreviation means the Relative Strength Index. The indicator shows the strength of the current trend and its possibility to be changed. Due to the fact that the RSI indicator is a very simple in use, it has been used by several generations of traders.
W. Wilder created this popular oscillator. First time the RSI was published in the journal Commodities in the late seventies. According to the author the indicator should be used on a two-week period for the best results. Wilder reasonably believed that such a period is close to be an optimal one. However, today traders use it on different periods. RSIisalsocalledastheindexofinertia.
Graphically RSI looks like a smoothed curve with the range from 0 to 100 points along the vertical axis. RSI is reflected in a separate window, the same as other oscillators. There are also two horizontal lines at 30 and 70 points in the indicator window. If the value of the oscillator at any given moment of time is less than 30, then this is an "oversold” situation (in other words oversold zone). The similar situation when the index values more than 70. This situation indicates the "overbought". These terms are used for easier interpretation of the oscillator signals.
The indicator is calculated quite simply. The positive and negative price changes are used for this purpose. These values are denoted as U and D. Positive change is calculated as follows:
U = Ct – Cy, D=0, where Ct is close today, Cy is close yesterday.
Negative change:
D = Cy – Ct, U=0
If Ct = Cy, then U=D=0
Then the values of the U and D parameters are smoothed with the aid of the exponential moving average with period N and are used to calculate the relative strength (RS) indicator and RSI afterwards:
RS = EMA(U)/EMA(D), RSI = 100 – (100/(1+RS)
Further the basic methods of this indicator application are described.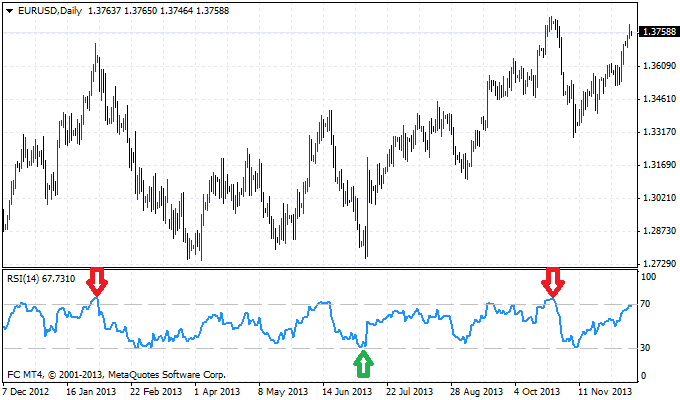
RSI indicator signals
Now when an idea of RSI indicators’ structure and calculation is clear we proceed to the description of its way of work. RSI generates several types of signals:
1. Overbought / oversold
As was described above, when the value of the indicator is too high or too low, this may indicate the market imbalance. The indicator location in an overbought zone can become a reason for sale, while the indicator location in the oversold zone, respectively, is a reason for the purchase (see the picture).
2. Divergences
Signals based on the divergences are not the prerogative of the indicator RSI only. Bearish Divergence is a situation when the RSI extremes are in downward trend, and the price graph trend still keeps growing impulse. This fact is a sign that trends are changing. At least, the likelihood of such development is increasing significantly. On the bullish divergence situation is similar and reflective.
3. The graphic patterns
The RSI looks as a smooth curve, which is also capable of forming all kinds of technical analysis trends and figures. Thus, besides analyzing of the price graph the trader can analyze the additional graph of the oscillator. This visual analysis can improve the accuracy of technological forecasts.
4. Indicator values trends
Usually, the price graph trend and indicator values trend coincide. Overbought / oversold as well as divergences formation and reversal patterns of technical analysis can be a sign of a possible trend change.
Modern trading systems are becoming more complicated. Now it is difficult to meet the strategy that would rely on the testimony of a single indicator only. Traders use several instruments as filters (such as averages, oscillators, etc.) to increase trade effectiveness. Relative Strength Index can be harmonious addition for any trading system.
Social button for Joomla