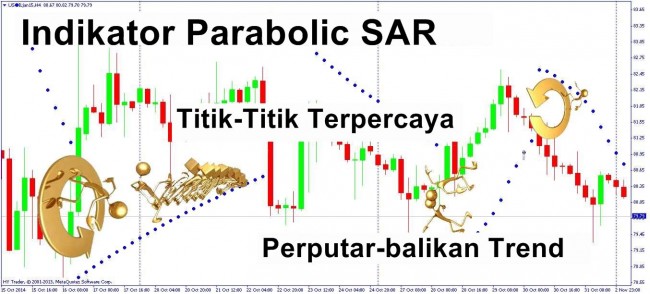
Fight with the effect of delay of technical indicators on the basis of moving averages has always been an urgent task. Parabolic SAR indicator has a mathematical model of a parabola in its structure, which reduces the delay on average volatility tools and allows you to catch the moments of a trend reversal.
The Parabolic SAR indicator was first described in the fundamental work by Welles Wilder "New concepts in technical trading systems". The harmonious shape of a parabola with the idea of stopping and reversal points (Stop and Reverse) is built directly on the price chart as a sequence of color pixels. The indicator is almost similar to the moving average, but moves with acceleration and changes its position relative to the price chart – the indicator on Up Trend is under the price (below), on Down Trend – over the price (above). The goal of the indicator is to provide a clear trend following and timely closure or reorientation of open positions at the moment of reversal.
It is a parabolic component that is capable to see the point of reversal before other indicators, as it responds not only to the movement of prices, but also to time. The indicator is less sensitive to the beginning of reversal than to its end – as the trend "ages", the rupture conditions become more stringent. The more prolonged the trend, the smaller price variations may cause the signal to reverse the position.
The presence of a clearly defined trend is the main condition for the successful application of the indicator. The accuracy of the signals at the closing position and reversal points increases with the trading period increase.
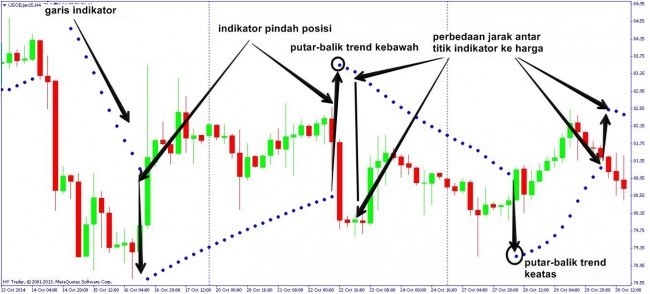
A visual rapture (reversal) occurs when the price crosses the line of Parabolic SAR chart and the following values of the indicator appear on the opposite side (above or below the price). The base point at the moment of reversal is max or min of the candle for the previous period. Rupture of the indicator is a signal of the end of the current trend (the transition into a flat) or its real reversal. The point of the indicator below the price means growth opportunities. Point over the price is a signal of the beginning of decline.
The sensitivity of the indicator is variable with the only parameter ¬– the acceleration factor (AF), which by default equals to 0.02 or 2%. The period can be changed: the less it is, the earlier the indicator will signal a change in trend, but a number of false alarms grows. At increasing the period, the indicator is late, but there are noticeably less false signals.
Mathematics of the Parabolic SAR indicator
Parabolic SAR calculation formula is:
where
SAR(n+1) – the future value of the indicator (tomorrow’s value) or a new value of the price for closing the position;
SAR(n) – the current value of the indicator (the current day) or the current value of the closing prices;
AF – acceleration factor;
EP – the last actual extreme point for long positions – high of the price, for short ¬– low of the price.
For example, the so-called indicative price (SAR) is determined by the indicator in an uptrend at any given time, which the real price should not fall below. If this occurs, the indicator automatically believes that the trend has changed (became descending), and the SAR price will show the maximum price above which the real price, according to the calculations of the indicator, will not grow.
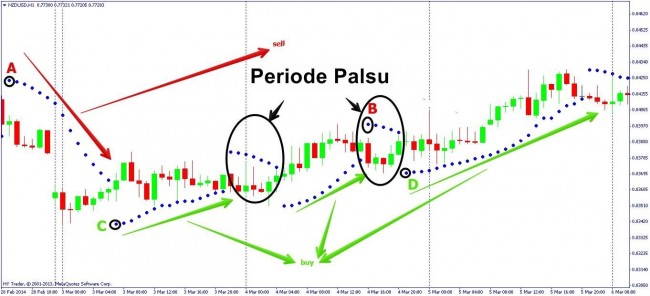
The indicator line has ruptures at the points of intersection with the price chart – the indicator’s points move in the opposite direction. The illustration shows the points A-B indicating the moment where the growing line of the indicator intersects with the price chart. Before these points the price grew, and after the point of intersection it began to fall – a downtrend reversal. Points C-D point to the fact of the price chart crossing a descending line of the indicator: up to this moment, the price declined, and after the point of intersection it has gone into growth – an uptrend reversal. The distance between the color points of the indicator is not always the same. The indicator approaches the price chart the more the faster (stronger) the real price increases/decreases.
Use of Parabolic SAR indicator in trading
If the market is "bullish", the points of the indicator will move up, regardless of where the current price moves. The amount of movement of the points of the Parabolic SAR line depends on the volatility of price movement. For the bearish market, the conditions are opposite. Back after the moment of crossing the line of indicator with the price chart, you can open the deal only after the appearance of 3-4 points of the indicator in one direction. Open positions are saved only in the direction of the main line.
Positions should be closed at the moment of maximum approximation of the curve of the indicator to the price chart (you need to put a take-profit in that point). Signal of the indicator comes with a delay, so if you do not react in time, you can lose some profits. Long positions are closed if the price goes below the indicator, and short ones – if it rises above the line.
Parabolic SAR indicator is an effective tool to determine the level of placing the stop-loss order for the closing position when the price is broken above/below the indicator readings. The value of the indicator is still slightly behind the actual price, and the stop-loss must be put right at the current point of the indicator at the time of entry, if it is not contrary to the money management procedure selected for your trading strategy. Sometimes, this indicator is used as a tracking line of the trailing stop.
The strength of the newly formed trend is estimated by the distance between the adjacent color points of the line – the more there are, the stronger the trend. When the trend has already gained momentum (the distance between the points of indicator is great), it may be too late to enter the market because of a possible correction or reversal.
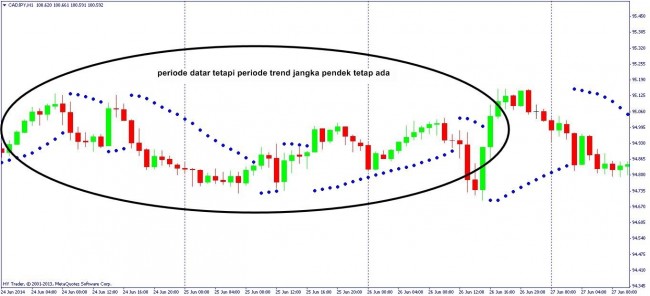
As with all indicators that are based on the calculation of the average value, the Parabolic SAR indicator gives many false signals when working at the flat market. But do not fix the already open positions if the price hovered in the lateral movement and the indictor continues to draw points in the same direction of the trend (above or below the price). While there is no rapture of the indicator, the current trend may continue.
The indicator is recommended for use on the periods of H1 and above, as at smaller timeframes its signals are unstable because of the "market noise". You can apply it to any average volatility trading tools.
Use in a bundle with other indicators
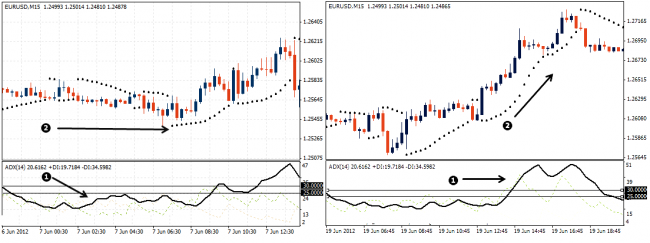
Parabolic SAR indicator signals can be confirmed by additional trend indicators such as Bollinger bands, but it is better to use the Parabolic SAR together with indicators of the trend strength (e.g. ADX), as it copes well with the definition of the direction on its own. If the ADX is below 25 (0.25), the trend is weak, which means that the use of SAR indicator signals is risky. If ADX readings indicate a strong trend, entries by the signals of SAR indicator can be effective.
And as a conclusion...
Parabolic SAR indicator is based on the home market principle of the directed trading: you should only open, move and close a position in the direction of the main trend and never work against the trend. It requires to set the order to close simultaneously with the entry into the market and move this bunch along the direction of the trend. The indicator protects the trader from erroneous or impulsive actions and educates trading discipline. Using this indicator, you can be trading virtually at any market time, since at the rupture of the indicator line the position is opened in the direction of the new trend.
Social button for Joomla


