

")
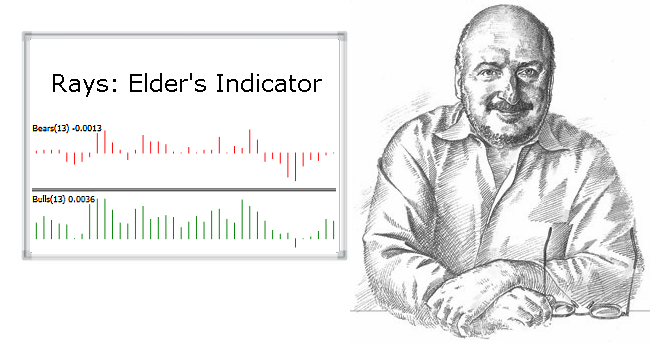
Famous trader Alexander Elder developed many technical indicators and trading systems, which successfully operate in all markets, subject to certain rules, so today we’ll review old but reliable Elder’s indicator called Rays.
The beginners are often confused about this algorithm, since, on the one hand, it is common to call a single file or code an indicator, while on the other hand, it is referred to in singular in the description of the authors’ systems, but it actually consists of three elements: Bulls Power, Bears Power and exponential moving. In fact, there is no contradiction, because each part is useless separately, and the signals are relevant only in the aggregate.
All the blocks could be combined in one algorithm, and then there would be no questions, but the famous speculator considered this inexpedient, since such an approach ties the hands of his followers and doesn’t allow to experiment.
Elder’s indicator is quite accurate, because it combines the advantages of oscillators and moving averages. The central element of the system is EMA, whose values are also considered when calculating the oscillators, characterizing a predominance of bullish and bearish market.
First of them is called Bulls Power and is calculated as the difference between the highest price for the period (HIGH) and the current value of EMA. The second is Bears Power, which works in a similar way, but instead of the maximum price uses the minimum in the formula (LOW).
Signals generated by Elder’s Rays indicator
Before you deal with entry points, we should note a few important moments. First of all, periods of EMA and both of the oscillators must match: using different values is unacceptable. Secondly, trading under this method requires a high concentration, so it is recommended to look for the version with sound alerts.
So, as it has become clear from the names of the main elements, Elder’s indicator analyzes the power of the two opposing market parties and recommends going in one direction with strong speculators. You must have the following conditions to buy:
-
Moving average is directed upwards;
-
Bears Power histogram is below zero. Ideally, each new bar must be higher than the previous, but it is often enough that the sequence of extremes satisfied this condition;
-
Extremes of Bulls Power histogram should also increase sequentially;
-
Additional condition, which is essentially useless in combination with the previous ones, is the presence of divergence on Bears Power.
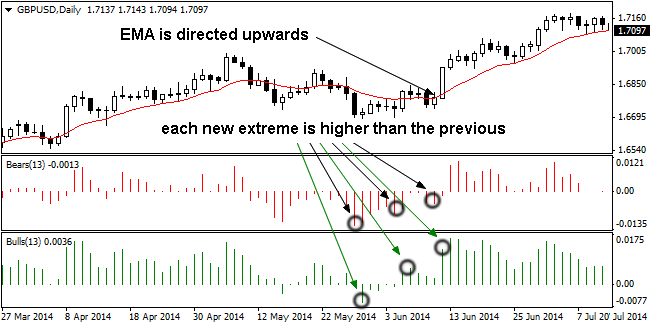
The “true” signal to buy is presented in the chart above. In this case, according the author's procedure, the filter to eliminate false signals is the positive value of Bears Power. We should note that the practice has shown the absolute senselessness of this disclaimer, because the most powerful and technical movements lead to positive values of the histogram. Signals to sell are treated exactly the opposite.
We earlier mentioned the uselessness of the divergences in the “trending context” of the Elders system, but it should not be completely discounted, because often “divers” are used in counter trend strategies. Given the fact that two different oscillators in the original version make an unambiguous interpretation of these signals impossible, in the end yet another indicator Elder ELR was created, which averages the Bears Power and Bulls Power values.
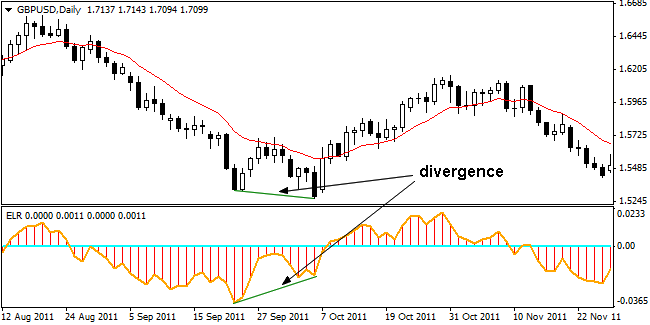
Numerous experiments have shown that ELR generates signals more accurately than the popular MACD, but similar to the RSI, the cause of which lies in the calculation formula. The figure above shows the classic example and appearance of the indicator.
Social button for Joomla