

")
 Every trader most probably has tried Gann indicators in modern online trading. These are the raw of the instruments for the technical analysis, which is based on mathematic calculations, which may be beneficial if it is used properly. That's why many traders make these indicators the basis of their trading strategy.
These indicators were invented by William Gann at the beginning of the XX century. He worked as a trader, who specialized on the stock trading. That's why the current wisdom is that this kind of instruments can be beneficial only for their inventors. But it is not true. Below, the general principles of Gann indicators’ work are described. The main direction of the analysis of the analytical instruments is the geometric figures, which shows price movements to the trader, and by these means helps traders to find a good moment for opening the order.
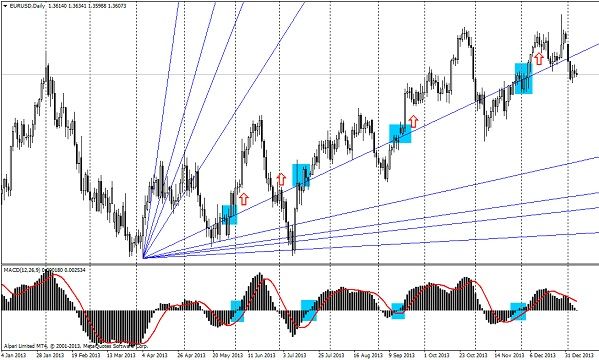
The picture shows the Gann fan. The middle line, which is built on two points, defines the direction of the trend. And other lines, which are lying above and under the center one, are a kind of levels of support and resistance. But in this case, the Gann fan was used with the MACD indicator, which gives us the additional signal. The order should be opened when the price crosses the main Gann line, or rebound off it.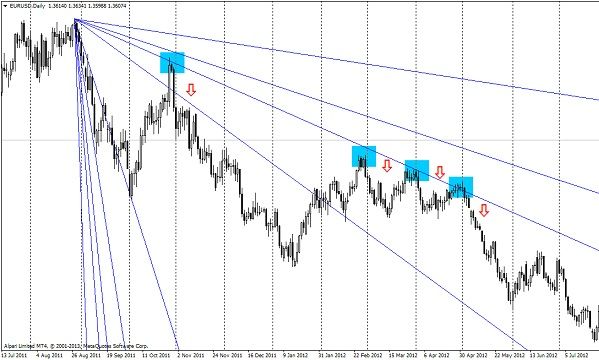
This is a good example, which shows how to work with the fan on the downward trend. The indicator will give the trader good moments for entering in perspective, after it indicates these two points. And, as the trend is bearish one should open down trend orders.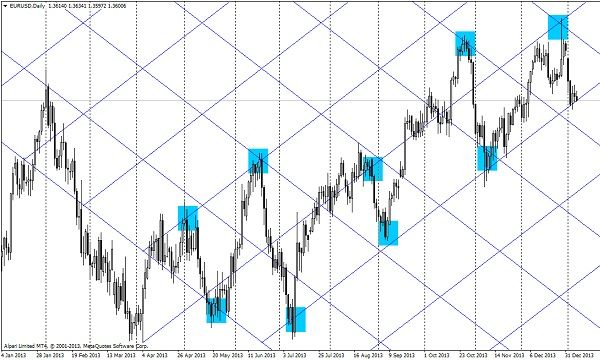
Gann indicators include such an analytic instrument as the Gann net. This net is built on two points, with the middle line forming the required angle or the square location is fixed according to the graph. To open the order you should define the rebound from the level, which is defined by the Gann net.
It should be mentioned that the fundamental principle which was founded by William was the 45 degrees angle. The main line should form this angle. If the price lies above it, the trend is upward. If it is under it, the trend is upward. Besides these two mechanisms, the Gann indicators include the Gann line as well. This is a simple line, which forms 45 degrees angle. This line is, indeed, the main orienteer for the direction of the trend. However, the picture below shows the situation with the use of another derivative line. 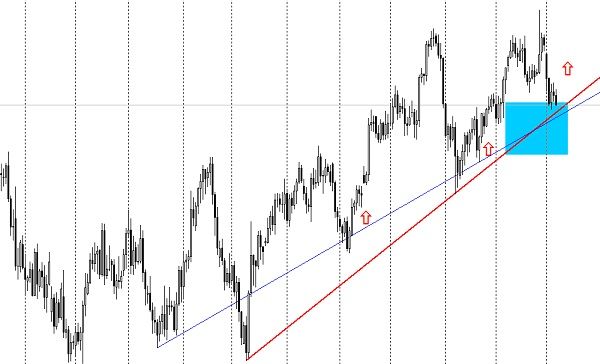
Let's investigate it more precisely. First and foremost, the Gann line can be used without any other graphic indicators. Orders, in this case, are opened when the price rebounds from the line. You should open buy orders until the moment, when the price will show the downward trend. That is, the price should move under the line.
But in this case we have one more line, which was built randomly. This picture shows that the meetings of line indicates zones of very strong, double resistance. And at maximum the random line can be penetrated and the Gann line can be tested. After that, most probably the price will continue to grow. It means that it is the time to prepare the buy order…
Considering everything what was mentioned above, we can draw a conclusion the Gann indicators form a cross functional graphic instrument, which can be used both independently and together with other indicators. It is a matter of individual choice. However there is no doubt that these William inventions can be called as one of the easiest and the most beneficial indicators among the best once.