

")
There are few channel indicators that have been successfully applied in the implementation of technical analysis, and you should consider a decent tool named TMA indicator. You can be sure that it relates to derivative indicators, but this doesn’t reduce its relevance in online trading. Its working principle is reviewed below, as well as its use in combination with other technical tools.
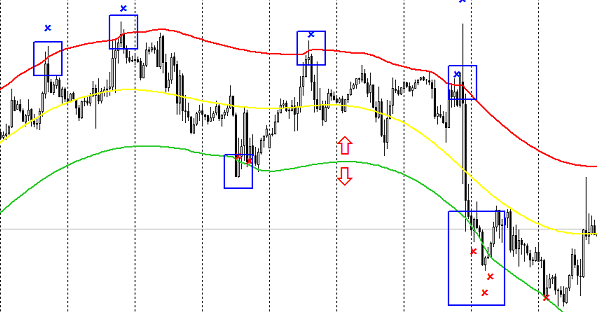
The TMA indicator consists of three lines, and those located at a high and a low play a major part. They are distant by a certain value, which can be indicated in the settings. This allows to select only the peaks and troughs you want. The principle is old: the rarer means the more reliable. Blue squares on the image show the marked peaks and troughs, and their calculation will determine the trade. The values (crosses) are defines by the indicator. Using the indicator on its own is very risky, since this tool has a habit to redraw values, and the orders opening can lead to significant losses.
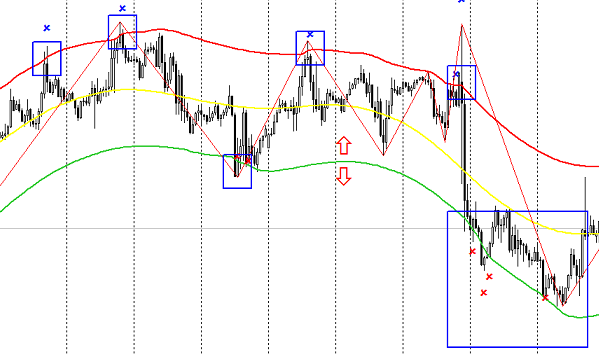
A filter is applied in such cases. The image above shows the addition of another indicator, ZigZag. Here you should pay attention to the settings. Since the TMA is a basic indicator, the second one should be adjusted after the basic is set.
Based on the values of the trading system we got in result, the order to buy or sell should only be opened when the signals and the first and the second indicators coincide. Thus, trading in the middle of the channel takes place. ZigZag in the image shows the value in the big blue box. This suggests that until the wave hasn’t yet been outlined by an additional indicator, there is a probability of false alarms. However, this channel indicator can be used more efficiently. If ZigZag has the same drawback as the TMA does, the Relative Strength Index is able to change the picture.
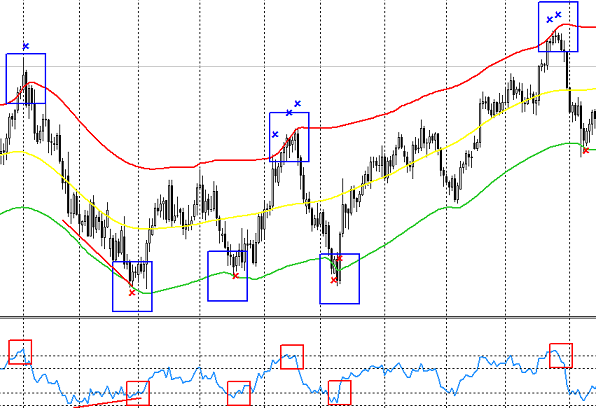
First of all, you should define the extremes and put them into the TMA indicator parameters. Then set the RSI values so that the false signals were smoothed out and the overbought and oversold areas were defined in comparison with the main indicator. The image clearly shows both indicators perfectly working out a common signal for the order opening. The only addition is 40 and 60 levels for RSI.
Thus, it is clearly seen how the TMA indicator signals a line breakout, while the RSI is in the “overheat” area. Now you just have to wait until the RSI level is crossed by the indicator line, and open the order. A stop can be set either above or below the extreme, and the profit is determined at your will. But there is an alternative: to work out a new high or low. If there is a series of false alarms, that is, a breakout of the TMA line, than the divergence is likely to be expected, which will be shown by the auxiliary indicator. Thus, a pair of failed deals can be compensated in full.
To summarize, we can claim that the trader’s main task still remains unsolved. With all advantages, no indicator can give the maximum probability that we all seek. The TMA indicator, even though it is a channel one, is no exception. However, the indicators of this type are widely used. All other things being equal, a trader can always profit from it if he shows all the qualities he has to possess.
Social button for Joomla