

")
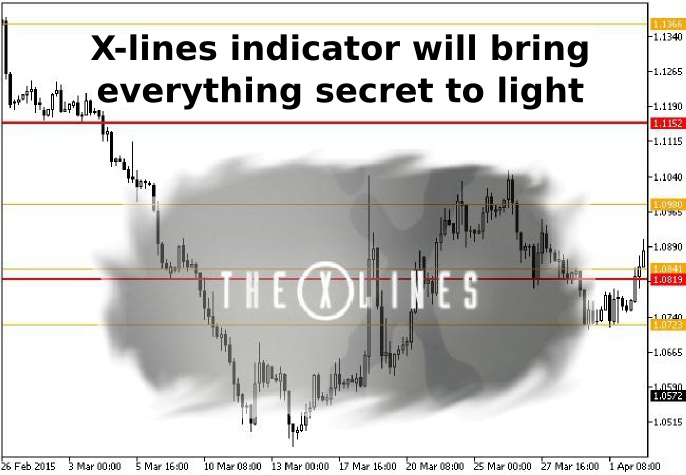
X-lines indicator provides a trader with comprehensive information about price levels that can be used to solve the most complex tasks, ranging from filtering the false patterns to creating a complete trading strategy.
Currently, there are versions of this algorithm for both MT5 and MT4, but the very first version was surprisingly designed specifically for Metatrader5, and when it became apparent that the indicator is rapidly gaining popularity among traders, it was decided to rewrite it for the fourth version of the terminal.
In general, the basic algorithm has not changed at the transfer, the changes were made only to the module of assessing strength levels, but this adjustment is more "cosmetic" and has no influence on the decision-making mechanism. But to avoid confusion, we shall revise all the nuances one by one.
Customizing the X-lines indicator
When creating the algorithm, the author based on the simple assumption that all levels can be divided into two large groups, the first of which includes strong price areas (where the big sellers and buyers protect their interests), and the second includes all other levels considered by speculators as local support and resistance. To implement this idea, we have added special variables to the code:
- Positional Power High Range (PPH) – a filter for selecting strong levels, by default it is equal to 0.08, but the user can customize this criterion. It should be borne in mind that the less this value, the fewer levels will be defined by the X-lines indicator as "strong";
- Positional Power Medium Range (PPM) – a similar indicator, which specifies the threshold for selecting the medium levels. The default setting in the settings window is equal to 0.15, but the trader can specify any value from 0.02 to 0.99, depending on their understanding of the market and collected statistics.
To avoid confusion, PPH should always be lower than PPM, otherwise the strong and medium levels on the chart will swap, resulting in many trading strategies failing to work correctly. And since we are talking about levels, let’s pay more attention to the chart:
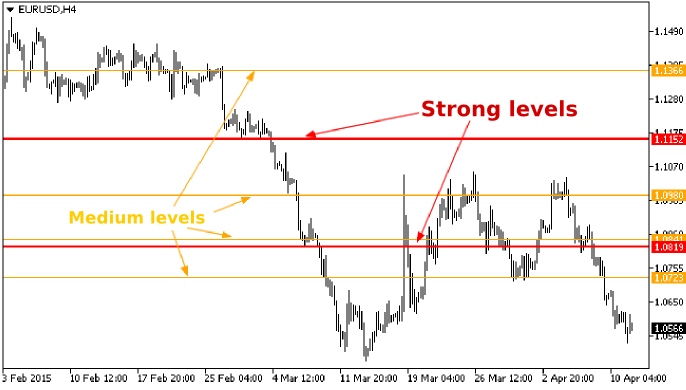
The X-lines indicator marks strong levels with bold lines and medium ones with fine lines. It’s not hard to guess that the user can change the color marking at their discretion – High Level (strong levels’ color) and Medium Level (medium levels’ color) were specifically added to the setting variables for this purpose.
And the last option available to configure is called Period of analysis, it is responsible for the depth of history that the indicator takes into account in its calculations. Much depends on the working timeframe, but it is better to leave the value of "0" – in this case, the algorithm will explore all available history.
Applying the X-lines indicator in trading strategies
Price levels take a central part in technical analysis – many traders identify prospective areas of support and resistance with their help, so the first strategy based on the algorithm discussed today is associated with the search for the best prices and ranges for transactions.
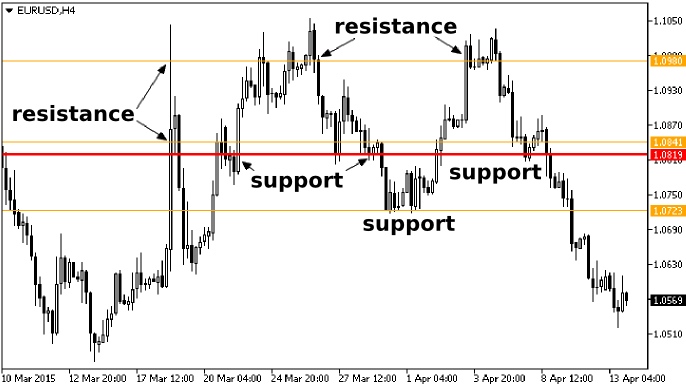
In this case, the X-lines indicator built all possible levels, because the Period of analysis was set to zero, while all the other parameters were left unchanged. If the price is above the red line – it stands as a support for the market, but if the price is below this level, it can be regarded as a resistance.
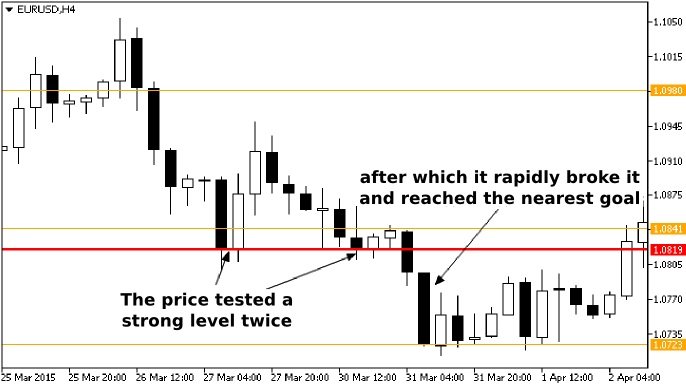
And now the most important thing: according to classic technical analysis, the horizontal layers are used in two ways – in the first case, the trader works on the rebound from the level, and the second – on the breakthrough. Actually, it is unreasonable to argue with this postulate, as this approach does work, but only in the case when you focus on the extremes and the real volumes when building levels.
But experiments and observations have shown that the X-lines indicator is doing well only when trading on the breakthrough of the levels, while the attempt to trade on the rebound did not bring a positive result. In most cases, the price movement is really suspended at the levels, but after only a few hours the earlier mood again prevails and the price breaks the support (resistance) as if it were not there, for example:
As we have already noted, this feature can be used to your advantage, and as for the reasons for its occurrence, they are connected with the peculiarities of calculation formulas underlying the indicator. It should also be noted that the quality of marking is not dependent on the trading instrument, the price behaves the same way close to indicator levels both on the currency pairs and on all other assets.
X-lines indicator as an auxiliary tool
While the points for opening positions can be searched by using strong levels, the medium strength levels may be useful in calculating the optimal values for the stop-loss and take-profit – inter alia, the nearest level can be taken into account for stop calculation:
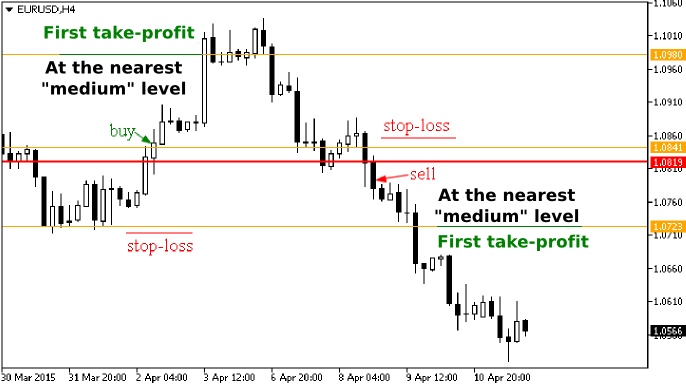
In the meanwhile, take-profit may be in different options – for example, the position can be divided into several parts, the goal for each is placed on its own level. On the other hand, the profit may be fixed after reaching the next level. In this regard, the X-lines indicator is universal, and the choice of a particular scenario will depend on the trader’s objectives and framework of the trading strategy.
As practice shows, the levels considered today are well combined with trend indicators such as moving averages, because the average prices only reflect the situation at the moment and can’t predict the future, and the use of levels allows to take into account the risks in advance.
X-lines indicator and its features
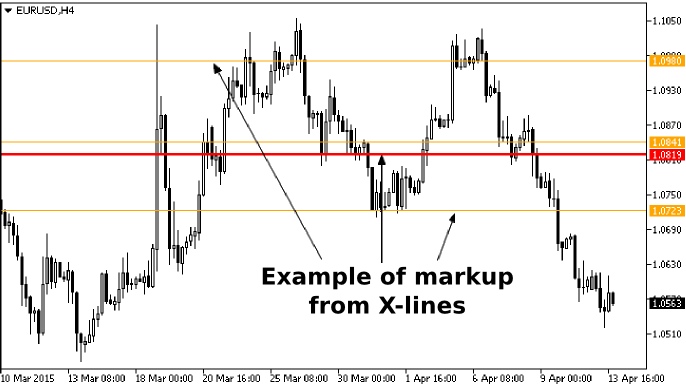
Concluding the topic, we’ll traditionally list the main advantages and disadvantages of the considered algorithm. Perhaps the most important advantage in this case can be considered a simple markup – the trader sets the indicator to the chart and gets detailed information.
The X-lines indicator also focuses not on price extremes that are seen by all market participants (by the way, this is why false breakthrough of the levels is formed more and more often – because the crowd sets foot in one place, creating a "bias"), but rather on its own algorithm. Such an approach reduces the probability of making erroneous decisions influenced by manipulation and provocation.
But these are not all the features. In the beginning of this article, we mentioned the changes made to the MT4 version. The fact is that many traders stopped dividing the levels on medium and strong and decided to consider each of them simply by the fact of existence (consider them equivalent), so the author of a new version simplified the code and removed this breakdown by using different coefficients.
As for the obvious disadvantages inherent to the "lines" under consideration, we didn’t find any – the algorithm works well and can compete with pivot levels. The only problem that makes inconvenience is a rich markup, especially if you enable the display of levels in history.