

")
- Details
- Written by Jeremy Stanley
- Category: Forex signals
- Hits: 4135

Many important occasions and news have occurred recently, many important statements have been made. The European currency fluctuates, confusing traders who intend to know future prospects. If it is difficult to determine the impact of the fundamental factors on the EUR / USD pair, one should use the method of technical analysis and look at indicators that will show the general trend of the currency pair and, most probably, will determine plan of further action.
- Details
- Written by Jeremy Stanley
- Category: Forex signals
- Hits: 3608

It's time to take stock of the indicator analysis conducted about two weeks ago. Let me remind you that we have analyzed the currency pair EUR/USD on the daily chart with the most popular and common tools computer analysis - RSI, MA and MACD. The result, unfortunately, is unsatisfactory.
- Details
- Written by Jeremy Stanley
- Category: Forex signals
- Hits: 4285

In this article, we will conduct a computer analysis (indicator) for the currency pair EUR/USD. LEDs do not have the absolute precision, but, nevertheless, most likely to allow us to estimate the current market condition and near-term prospects.
All indicators have their initial settings except Moving Average, need to put the period 200. For greater accuracy, we will analyze the daily charts. So, let's see what signals give our selected indicators:
- Details
- Written by Jeremy Stanley
- Category: Forex signals
- Hits: 3749

AUD/USD pair didn’t do anything during the session on Monday, due to Memorial Holiday in the US there was a very low liquidity. Besides the British were celebrating “Spring day off” and as a result the liquidity was at a low level for the most part of the day.
The area where the AUD/USD are trading right now is a significant support. In fact this area is a long-term support for this market, that is why at the moment it plays a significant role. We assume that one may observe formation of new intermediate tendency, up or down.
- Details
- Written by Jeremy Stanley
- Category: Forex signals
- Hits: 3977
Without listening to our analytics and assurances of several respected analytics, euro from the position “why not continue the descending trend” jumped into the situation of “I deceived you, bears, successfully”.
On Tuesday the situation on EURUSD could be characterized with these words.
- Details
- Written by Jeremy Stanley
- Category: Forex signals
- Hits: 3767
Indeed the hottest forex tool right now is gold. Such volatility on precious metal hasn’t taken place for a long time (since 2011).
Gold is being clearly merged. The gold has been falling for the second trading day (gold has been descending during Friday, Monday). And there are no grounds to assume that this fall will stop in the next Tuesday.
However one should remember that with these great movements the possibility of abrupt and volatile short term resistance of quotations is very high. It is important to be careful with “hunting stops” on gold. A recommendation on this tool is universal right now – keep sales and attract stop losses, fixing the major part of the income.
- Details
- Written by Jeremy Stanley
- Category: Forex signals
- Hits: 4036
Europe, except for probably Estonia, had a day off on Monday, celebrating the Easter Sunday, but the market on Monday brought two pretty good trading signals for new deals. The first one appeared in the morning European time, the second one ta the end of the day, but both were confirmed only at the end of American session.
In chronological order the first signal was the signal to sell the USDJPY pair. The pair quotations broke down the level of support of 94.000 in the Asian session and descended, without trying to make an attempt to rehabilitate oneself.
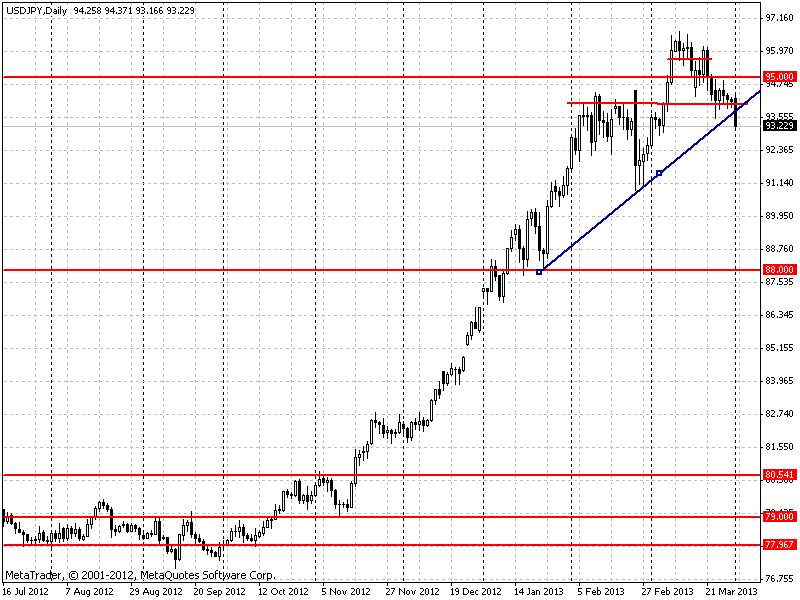
USDJPY pair has not been successful at showing a decent growth during the last two months while trading in the diapason. However, the ascending trend is still the main trading idea, but now it is more urgent to trade in short with close stops.
- Details
- Written by Jeremy Stanley
- Category: Forex signals
- Hits: 3812
As it was mentioned earlier, this week the destiny of gold quotations could be decided. They could either hang in timeless consolidation, or a trend could begin. We should see how this problem has been solved.
On Tuesday gold could overcome the level of resistance of 1677 and to leave the diapason, which brought hope to build for the beginning of trend. On Wednesday gold was trading with low volatility on this level, making attempts to break it down.
On Thursday the gold quotations were trading more actively in American session and attempt to break down 1677 for a troy ounce level were more successful than the previous ones. But the quotations could not consolidate during the day lower than this level, and the price for the precious metal again became higher than 1677.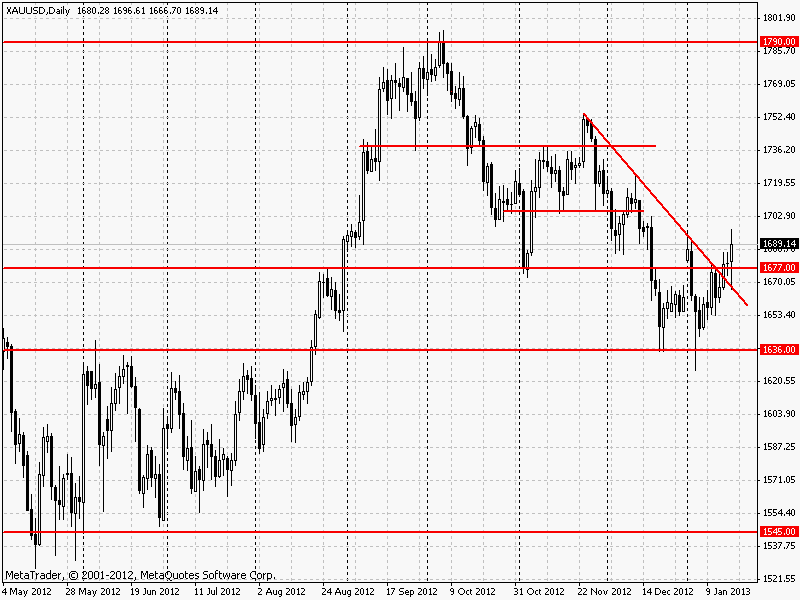
- Details
- Written by Jeremy Stanley
- Category: Forex signals
- Hits: 3774
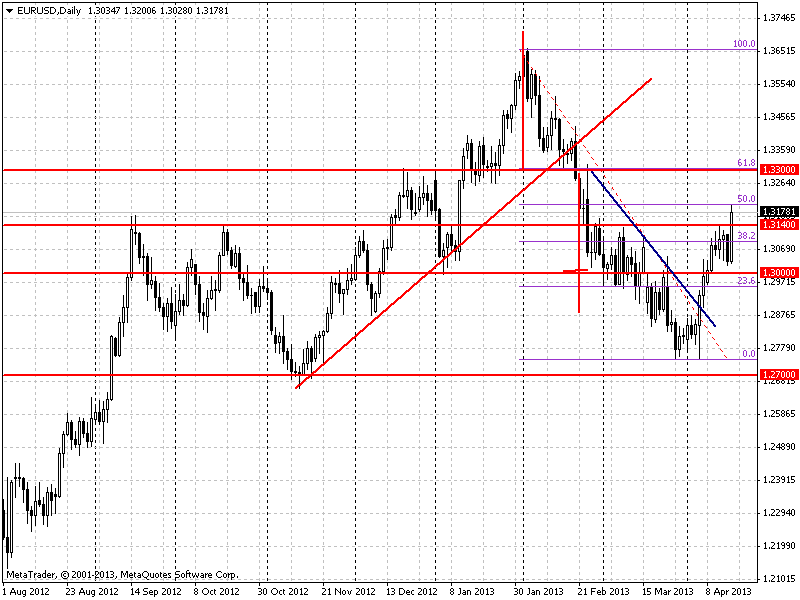
Active purchases of EURUSD pair increased the quotations of the pair higher than the resistance level by 1.3140. Now the quotations are above the indicated level, which was insuperable for EURUSD pair twice within 4 months.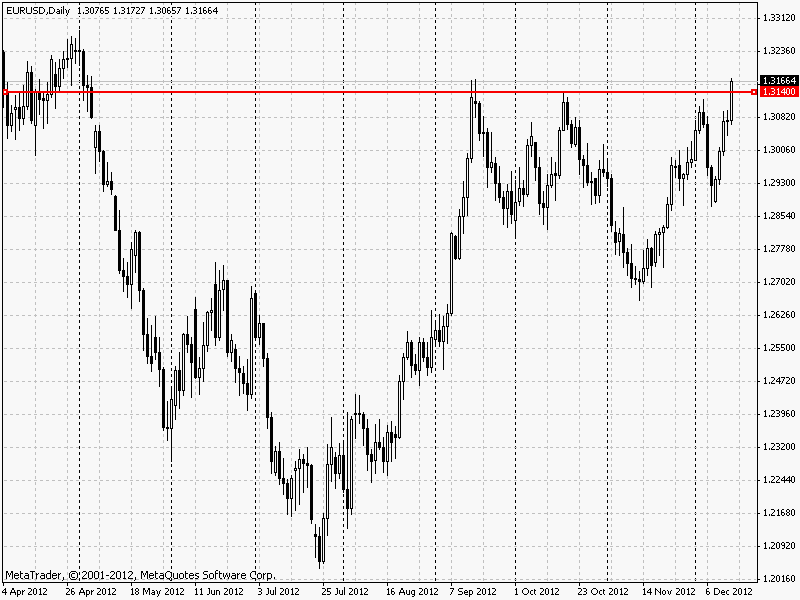
It is early to say that the pair consolidated above the resistance level, since it is necessary to wait the end of trade session. If the pair consolidates above the resistance level, it will become a good signal to keep the ascending trend, that started in November and stumbled over this level.
The potential aim of the ascending movement can be a resistance level of 1.3500, if New Year doesn’t interfere, of course.
- Details
- Written by Jeremy Stanley
- Category: Forex signals
- Hits: 3909
Despite the fact that the pair pound sterling against US dollar looked weak on Monday, it justified its signal for purchase, which occurred the same Monday.
GBPUSD pair grew to its local maximum by 1.6130 and it is attacking it actively. At the moment of writing this post the second half of American session, the pair is making a second attempt to consolidate higher than a local maximum of 1.6130 that is currently became the resistance level, which is preventing the ascent of the pair.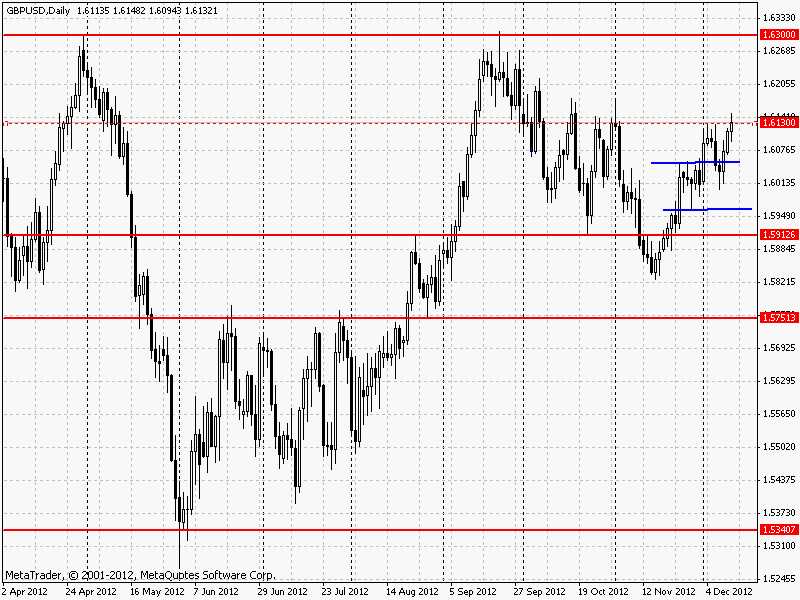
The first attempt of maximum renewal ended in serious interdaily lowering of the pair, but the pair is recovering successfully its lost positions.
- Details
- Written by Jeremy Stanley
- Category: Forex signals
- Hits: 4149
On Wednesday during American session currency pair USDJPY exited the diapason, in which it was trading until the middle of November. Thus there is a graphic figure “flag” being formatted, that it the signal to continue the ascending trend.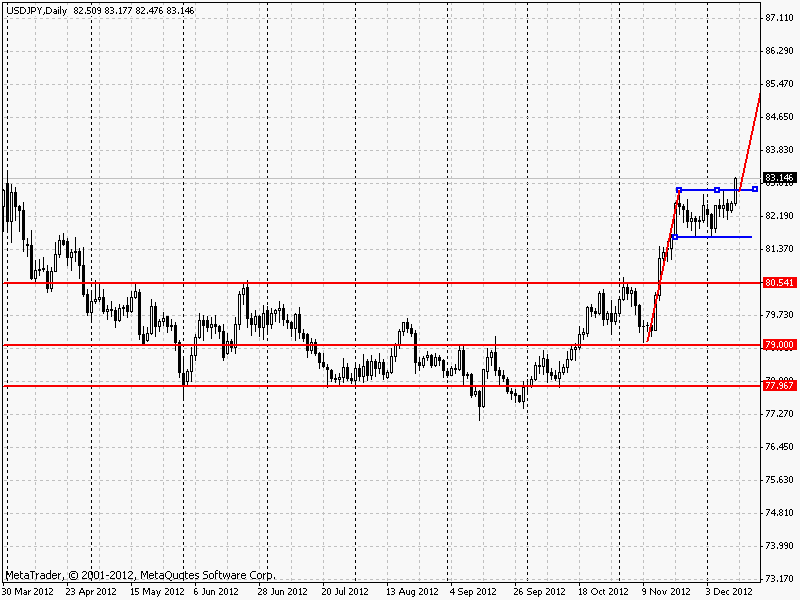
Thus the ascending trend USDJPY that started at the beginning of November has to stop and the theoretical growth of the pair must be 2/3 of the size of the flagstaff.
- Details
- Written by Jeremy Stanley
- Category: Forex signals
- Hits: 3786
Today the ascending trend on gold was confirmed. On Monday the quotations of yellow metal grew almost continuously and they easily overcame the resistance level 1705, which confirms the strength of the trend. And for people who did not enter the recommendations before week of trading, the evening of Monday is the best opportunity to open gold long positions, since with end of trading session in the USA there is a slight correction in the US towards the interdaily growth and a possibility exists to open with good price.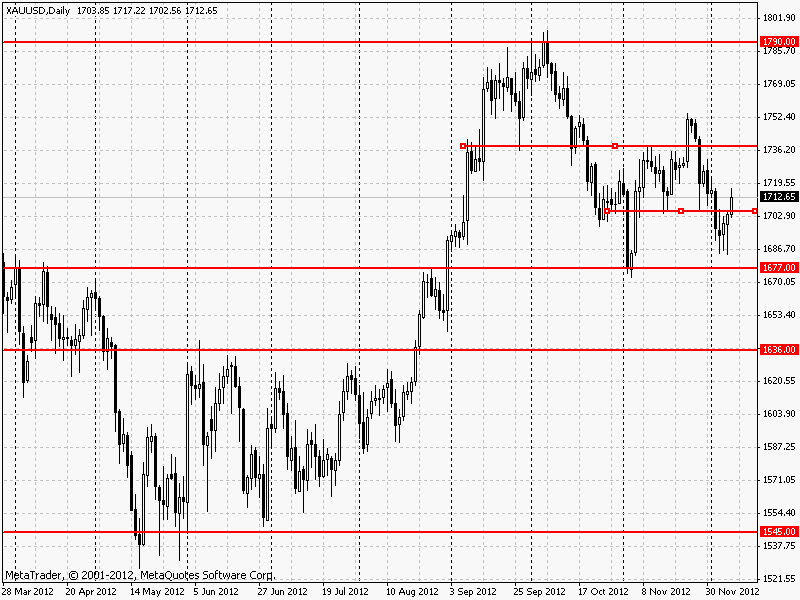
The aim of ascending movement on gold is the resistance level of 1738. The gold has all opportunities to reach this resistance level for two trading weeks of December that are left.
- Details
- Written by Jeremy Stanley
- Category: Forex signals
- Hits: 3691
On Thursday GBPUSD pair looked better than EURUSD, but it was influenced by dollar’s growth. And a signal for deployment on this pair was formed- within two narrow diapason days there is a bear absorption. Unlike Euro where the preliminary signal for deployment was formed on Wednesday, the signal for pound sterling appeared only today.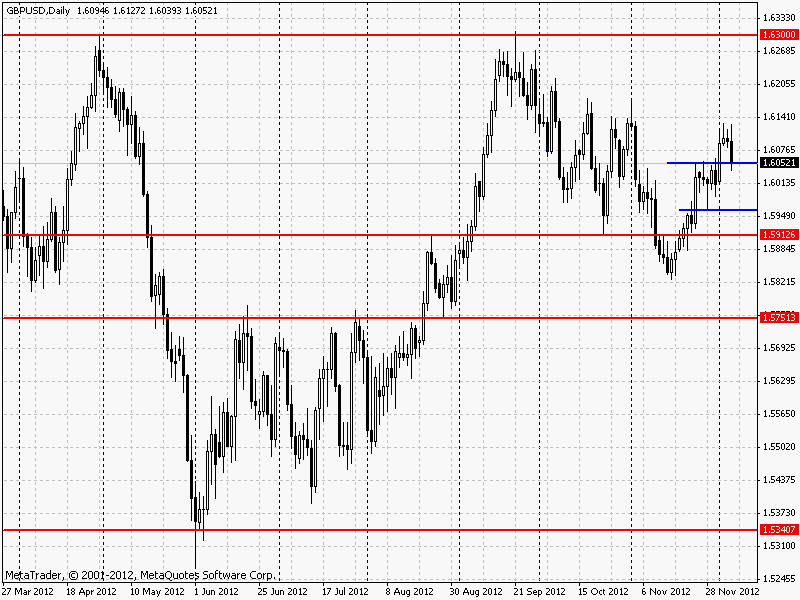
Thus GBPUSD pair has potential for lowering further. The opening of short positions on current levels is pretty risky, since there is a possibility of support from this level of support, created by upper boundary of short diapason of November.
- Details
- Written by Jeremy Stanley
- Category: Forex signals
- Hits: 3852
We stated on Sunday in our weekly review that gold might stop its movement down, since the level of support 1700 kept the balance after two failed attempts to break it down. On Monday we saw a good practically ceaseless growth of quotations of yellow precious metal. Thus there was a deployment candlestick signal on gold in the form of “reverse falling star” with candle- hammer on Friday.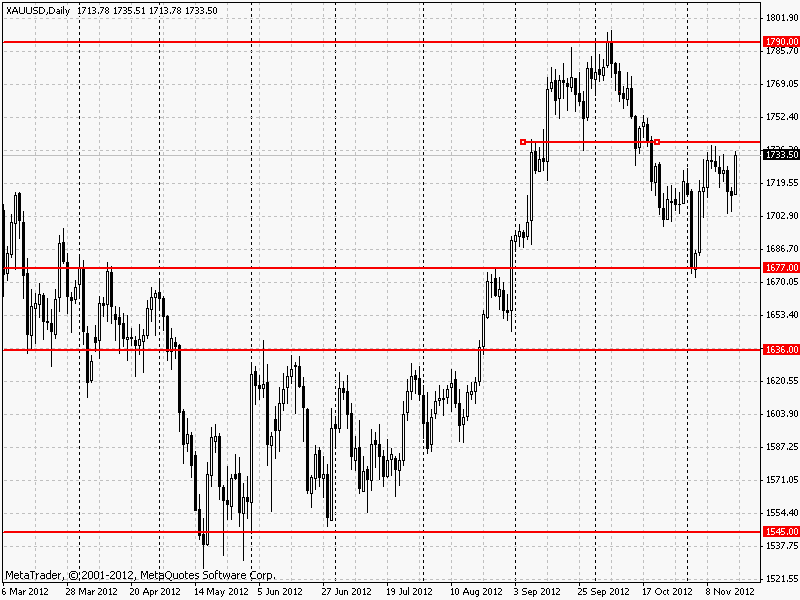
This is a good deployment signal and under other circumstances it would be necessary to start buying gold from the current levels, but there is one technical limitation to start buying. This limitation is in the proximity of the resistance level, which is on the level 1740, the level that stopped the growth earlier that month.
- Details
- Written by Jeremy Stanley
- Category: Forex signals
- Hits: 3695
The hurricane with a female name brought its own corrections into trade, since during the first three days the deployment of dollar took place and now it is not growing, but falling. It may be caused by very significant loss provoked by bad weather. According to the latest assessments, the damages may be around 50 billion dollars, which is a significant burned for weakened economy.
Two good signals appeared on Wednesday. The first one and a very beautiful one was long-awaited, which was the signal to buy gold. Gold had been in a narrow consolidation, that looked like a triangle, for several days, but it was broken today. Undoubtedly it was broken very fast which means that the current impulse is strong, and there are chances that the impulse will grow into a steady tendency. It is worth buying gold anyway, because the psychological mark of 1700 turned out to be insuperable for the descending movement and now there is a possibility that the quotations would be growing up to the next psychological mark of 1800 dollars for troy ounce.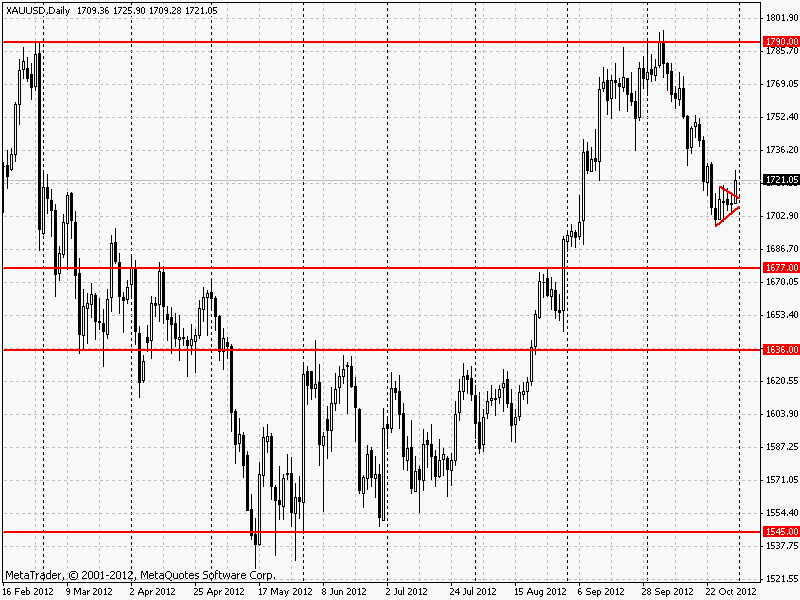
- Details
- Written by Jeremy Stanley
- Category: Forex signals
- Hits: 3582
As we mentioned in our weekly review, pound sterling was attractive for sales today, and there was a little descent of quotations from upper bound of the channel. There are no reasons to consider the movement exhausted, that is why on should keep the short positions of GBPUSD for more, by securing it with a protective stop loss.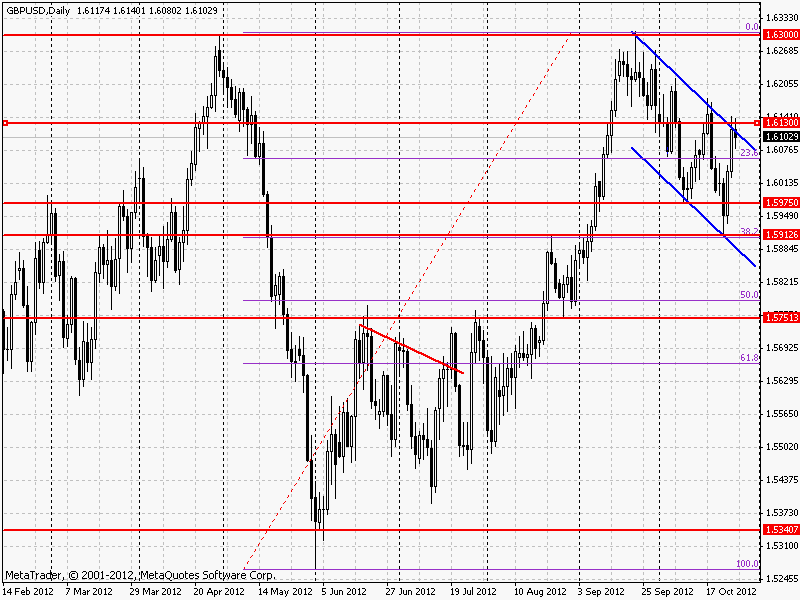
There is one question now: what level may GBPUSD pair reach during next days? To be honest, there are doubts that the pair can reach lower bound of the channel, since it will mean an abrupt fall in comparison with other currencies, and there are no reasons for that. Angle of elevation of the channel is too steep while other currency pairs are in the flat. That is why GBPUSD may find the support ta the level of 1.5915. One should keep current sales up to that mark.
- Details
- Written by Jeremy Stanley
- Category: Forex signals
- Hits: 3750
Pound sterling grew significantly during last two days. It even broke the descending channel (blue lines on the graph). It is starting to consolidate, but the movement of quotations on the graph H4 is hinting at formation of local top.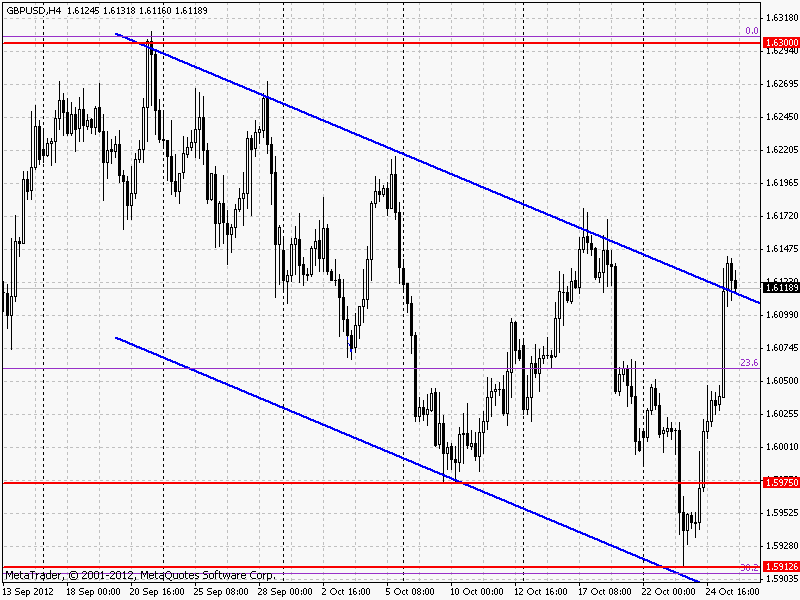
It isn’t recommended to hurry up, but one should look carefully at GBPUSD on Friday. The possibility of closing long positions if pretty high, and GBPUSD pair may return to the channel and descend. It will be possible to sell at the entry into the channel. It is possible to sell lower than 1.6100-1.6105.
- Details
- Written by Jeremy Stanley
- Category: Forex signals
- Hits: 3614
If after trading Wednesday there were only assumptions about possible deployment of descending tendency on many snit-dollar pairs, on Thursday signals proved and quotations went up. Thus EURUSD pair on Thursday finished its deployment model of doji-candlesticks by bull absorption.
Thus a double local turned over top was formed on EURUSD pair at the level of support of 1.2820-1.2830. The deployment of EURUSD local and long-term positions is not likely to result from current situation, and short purchases can be done now or later, since the ascending movement is possible up to the level of resistance of 1.3040.
Almost the same situation may be observed on pound sterling and US dollar pair. A good deployment candlestick model is clearly seen on the graph- a “deployment model”.
- Details
- Written by Jeremy Stanley
- Category: Forex signals
- Hits: 3585
We doubted about giving prognosis about future pairs movement for a reason, since on trading Wednesday dollar gave up its established positions and there is a possibility that on Thursday we will see the continuation of ascending trend on anti-dollar pairs.
For example EURUSD pair formed a doji- candlestick in area of consolidation, which means that there is no signal for continuation of sales, one should consider the possibility of buying at the beginning of trading session on Thursday. A limit of growth for EURUSD pair is the level of resistance of 1.3040, after passing which the pair can go further.
Pound sterling stopped lowering as well and it drew doji-candlestick, which shows a temporary weakness of descending tendency, which can turn into a rebound or continuation of fall of GBPUSD. Since lately pound sterling and euro are together with high correlation, it is more preferable to look at purchases on the basis of situation analysis of euro, which is situated higher. However it is worth mentioning that there is no signal for purchases!
- Details
- Written by Jeremy Stanley
- Category: Forex signals
- Hits: 3404
It’s difficult to see a trader trading actively on American pair USDCAD (the American dollar against Canadian dollar) because of the correlation of economic processes inside these two allied countries, which made the fundamental calculations on the prognosis of currency development unsuccessful.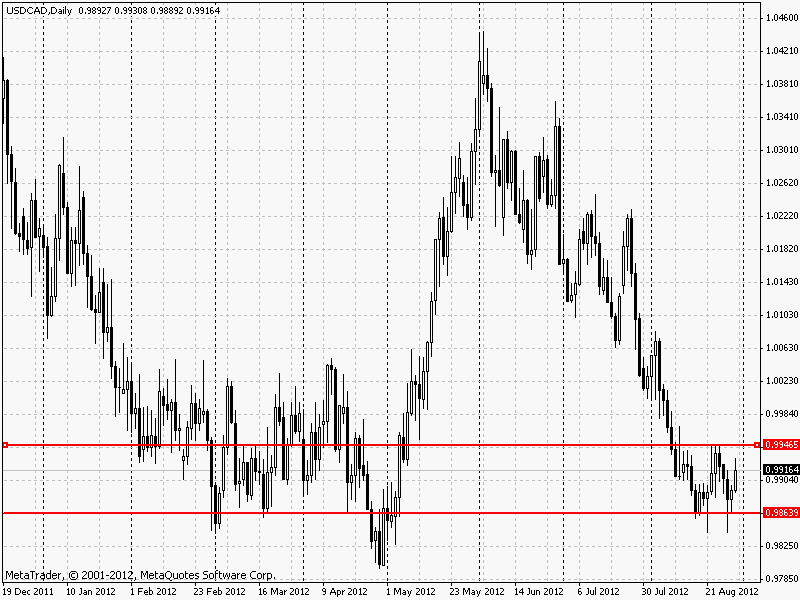
Now it is worth paying attention to this pair because of the possible formation of strong reverse signal- double bottom. To consider the signal complete it is necessary to expect the breakdown up by 0.9946 (it is nice to have patience and to expect the rebound from this level after the breakdown).
- Details
- Written by Jeremy Stanley
- Category: Forex signals
- Hits: 3615
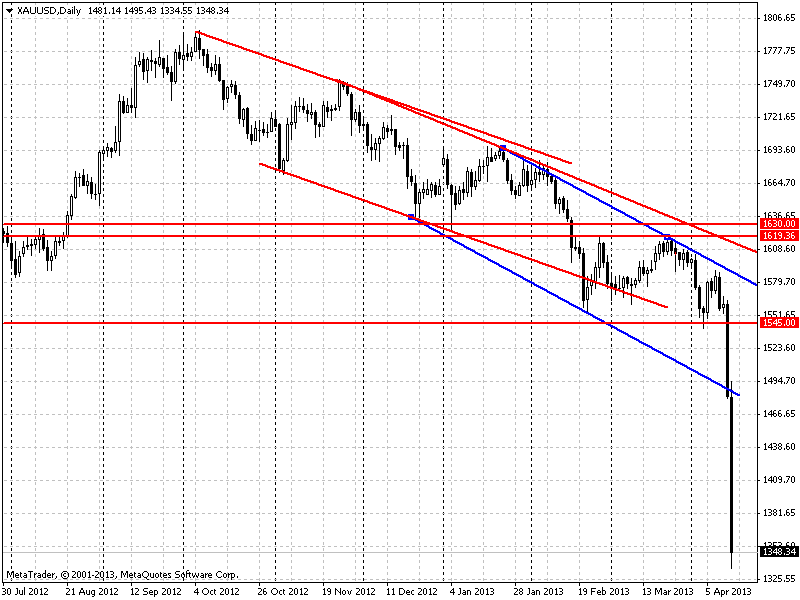
The gold sticks to correction, the signal of beginning of which started on Monday. The gold lowered the quotations from local maximum by 22 dollars for 1 ounce and is now quoted for 1655.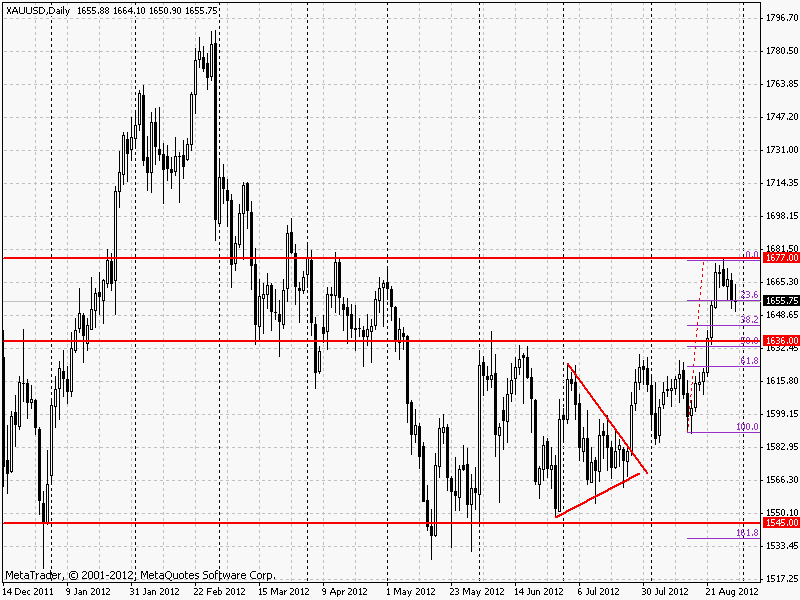
In spite of the fact that on Thursday there were some troubles on market that were connected with FRS meeting and Ben Bernarke’s speech, descending short-term tendency did not change and most likely the gold will continue descending to 1645 where 38.2 percent level of correction is to the previous growth by Fibonacci. The next obstacle for quotations decrease is the level of support of 1636.
- Details
- Written by Jeremy Stanley
- Category: Forex signals
- Hits: 3727
A good ascending trend that broke down the resistance on 1636 mark found a resistance on the mark 1677 dollars for 1 troy ounce of precious metal and stopped, consolidating lower than a given mark.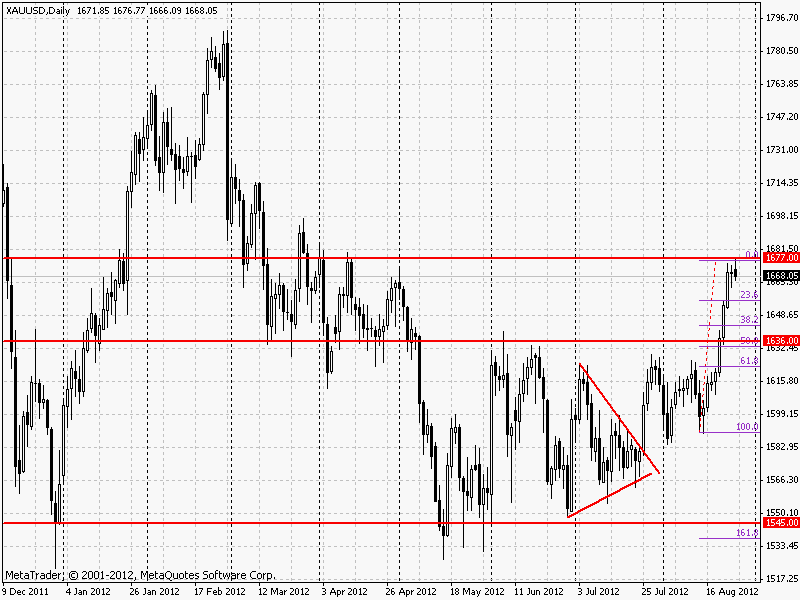
The resistance is not evident but starting from November 2011 on this level (or around it) there was a significant number of local extremums, probably the same situation is going to occur soon.
The confirmation of the possibility of correction to the previous growth of quotations are doji-candlesticks for previous trading day (Friday), which means the weakness of bulls and growing struggle between buyers and sellers. After Monday the candlesticks have a dark body and a narrow diapason of a trade, which testifies a prolonged struggle with dominating descending tendency.
- Details
- Written by Jeremy Stanley
- Category: Forex signals
- Hits: 3401
The last four trading days (this whole week) the AD- US dollar pair has been trading within an interesting narrow diapason. It is interesting because it reminds a forming flag, the breakdown of which will mean the continuation of ascending tendency. However, the character of daily candlesticks points at the weakness of ascending tendency within a trading day and all these with the background of perfect growth of petroleum on all markets (the Australian dollar correlates towards petroleum and gold).
Double interpretation of current situation defines well the necessity of protection or the closing of current long positions on AUDUSD pair.
- Details
- Written by Admin
- Category: Forex signals
- Hits: 3972
![]() Reached the resistance at 1.2630 eurodollar ceased its growth. In connection to the Bernanke's speech slightly higher level of the volatility was spotted on the market and assets did not look strong on the Thursday. As there were no signals of the third round of quantitative easing the traders were disappointed and the market growth ceased. Mainly this reason stopped the growth of the assets.
Reached the resistance at 1.2630 eurodollar ceased its growth. In connection to the Bernanke's speech slightly higher level of the volatility was spotted on the market and assets did not look strong on the Thursday. As there were no signals of the third round of quantitative easing the traders were disappointed and the market growth ceased. Mainly this reason stopped the growth of the assets.
Bernanke did not give any significant information and accordingly the markets reacted to the other news. As a result pair EUR/USD was destabilized by the news from Fitch rating agency by the time of the american trading session closing. It was reported that Fitch lowered the credit rating for Spain by 3 points, from A to BBB. Short-term rating was also lowered from F1 to F2.