

")

It's time to take stock of the indicator analysis conducted about two weeks ago. Let me remind you that we have analyzed the currency pair EUR/USD on the daily chart with the most popular and common tools computer analysis - RSI, MA and MACD. The result, unfortunately, is unsatisfactory.
So, the last time there was a significant deviation from the performance indicators and the indicators in turn pointed to the downward trend. What went wrong? What is wrong? First of all, we note that the behavior of the market and current prices was achieved largely under the influence of fundamental rather than technical factors. Temporary solution to the problems the United States, the negative economic news showgirl and reduce the probability of rolling program of asset purchases in the near future. Market participants reacted to this sellout of the American currency. As we know, the indicators do not work well in the time of the news and the periods when the news has a strong influence on people's opinions, and economic conditions in general.
The second reason will be hidden in the ambiguity of the signal indicators, we may interpret them incorrectly. On the one hand indicator MACD and MA showed a rising trend, while the RSI is pushed away from the overbought zone and decreased, giving a sell signal. Let's take a fresh look at our indicators.
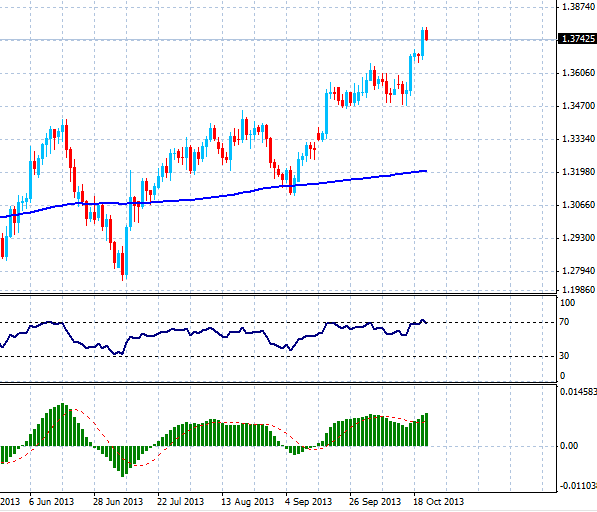
MACD is above zero, indicating a rising trend. Histograms are growing in line with the price divergence is observed. Next in line to a simple moving average with a period of 200 days. From the graph it is clear that the price is higher than our movements, so we are in the area shopping. Oscillator RSI indicates perepokupku, but given the fact that we have a pronounced upward trend signals oscillators are losing relevance.
If the last time we also interpreted the indicator signals, the effect would be positive. From now on, we will describe the direct signal indicators, regardless of the position of price and its deviation from their values. As a result, we can say that the market is favorable for shopping, both indicators show a rising trend. Support is at the 200 day moving average, and only a lower price fixing movement will signal the beginning of the turning movement.
Social button for Joomla