")

In this article, we will conduct a computer analysis (indicator) for the currency pair EUR/USD. LEDs do not have the absolute precision, but, nevertheless, most likely to allow us to estimate the current market condition and near-term prospects.
All indicators have their initial settings except Moving Average, need to put the period 200. For greater accuracy, we will analyze the daily charts. So, let's see what signals give our selected indicators:
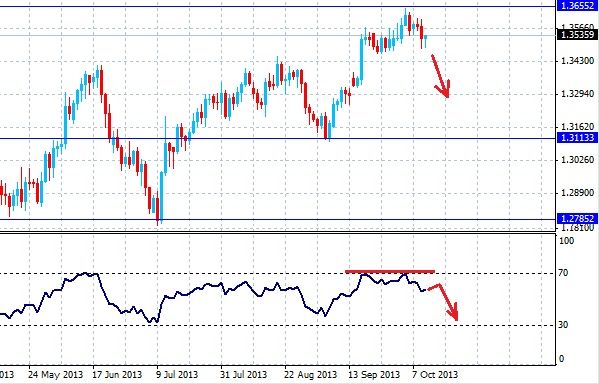
- RSI - the indicator line twice strayed from the values of 70 and is now declining, this behavior indicates it's a further decline in prices. In other words, the pair EUR/USD tends to weaken rather than to growth. The current price is attractive for long-term and medium-term traders, the stop order is placed at 1.3660, target sales level of 1.3107 . Short-term traders should keep in mind that the transaction to sell have greater potential than the purchase.
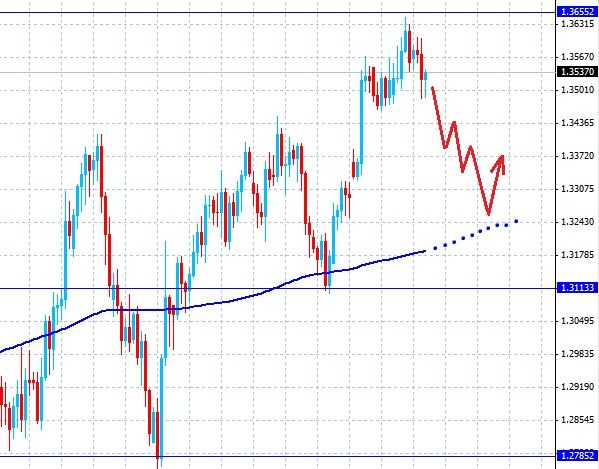
- MA(200) - the price is above the moving average, it's an indication that there is an upward trend, or it existed long ago. But in this case the price is quite strongly deviated from the moving average, and most likely will for rapprochement. It's worth remembering that the 200 day moving can act as support or resistance, depending on the position of price, in our case it's the support.
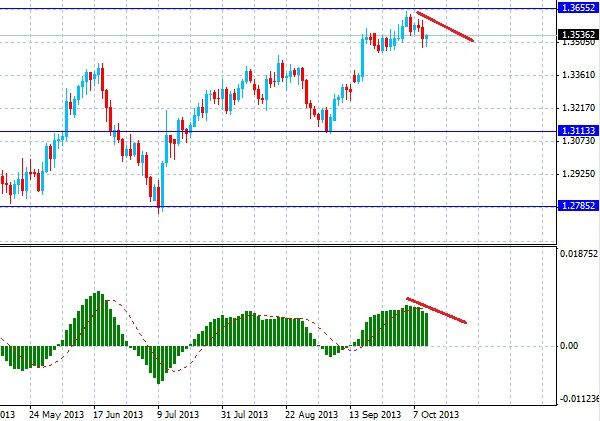
- MACD - Histogram are above zero, which is also a measure of the rising market. After reaching a maximum price of a pair of EUR/USD, MACD began to decline along with the quotes. There is a tendency to top discharge indicator (movement to the zero level). The LED indicates the abatement of force upward trend, so it's advisable to buy a pair of EUR/USD from current levels. Out of a short position when the MACD should then fully discharged - reaches zero.
From the analysis shows, most indicators point to a decline of the pair EUR/USD in the near future. This assay is designed for long-term and medium-term traders, verify the efficiency of the signal in a week.