

")
Proper use of the volume correlation mechanism allows to catch the moment of large "smart" money entering the market. The proposed precise strategy of tick volume analysis is another alternative to short-term trading and the opportunity to earn with the market makers.
Financial markets are controlled by ordinary people who create the main driving force – trading volumes. The composition of the trading members, the size and direction of the volume make up the largest market secret.
Volume analysis helps at least indirectly assess the activity of professional players who set the rules, start new trends, "pull" the price by major transactions and create traps for the market "lemmings".
Price movement is always forced by an imbalance of supply/demand. The trader is obliged to constantly monitor the dynamics of volume, so that in no case they entered the game against the big players. Precise strategy of tick volume analysis helps understand market sentiment in time and work with the market billions in the same direction.
Mathematics of the market volumes
Due to its decentralization, Forex market is technically unable to give the trader the actual data on the volume. What the trader sees in the Forex terminal is tick volume that shows the number of times the price changed over the period of time. Some call it the number of transactions, but the actual amounts poured into the market can’t be seen. It is believed that tick volume does not make sense for the trader. Not everyone has access to data on the real exchange volumes (e.g. from CME), and if you're not among the lucky, tick volume data can also be used effectively.
In fact, the absolute volume values do not matter: the market does not care whether one player entered with a hundred million or a hundred players entered with one million each. Only relative dynamics matters – i.e. what kind of volume entered the market: large, medium or small.
Each price change under the precise strategy means real request of the members to open/close the transactions. If the activity increases dramatically, it means that the market maker gives pulse to the crowd in a certain direction. Once there are enough open transactions in this direction, the huge volume rapidly reverses and starts earning on their "attracted" colleagues. The precise strategy on tick volume will allow to work in sync with the big capital, that is, to have time to enter at the beginning of a trend and exit (or reverse) at the first signs of a reversal movement.
Installation and description of the indicators
Work on any instrument (currency, options, stocks, futures) is conducted on M15-M30. Only two standard indicators are required: MFI (or Market Facilitation Index) and Volume indicator (Tick or Real, if possible). The setting is standard, both indicators are of the oscillator type (the parameters include only colors) and are arranged in additional windows.
Volume indicator
This precise strategy assumes that the tick and actual volume equally reflect the market picture. The price change and the strength applied to it (number of open transactions) are analyzed considering the basic concepts of candlestick analysis.
- Volume grows, volatility is low, bullish candles are available – future price growth.
- Volume grows, volatility is low, bearish candles are available – future price decline.
- Price grows, volume falls, but this follows a situation No.1 – possible long-term trend.
- Price grows, volume grows, this follows a situation No.1 – possible short-term trend.
- Price falls, volume falls, this follows a situation No.2 – possible long-term trend.
- Price falls, volume grows, this follows a situation No.2 – possible short-term trend.
The index of "relief" in the market: MFI indicator (Market Facilitation Index)
Its high histogram bars tell about the weak (low) resistance to the current price vector, and the combination of this growth with falling volume (under the Volume indicator) tells about the stability of the "intention" of the market to continue to move in this direction.
It is believed that the beginning of a new trend (reversal of the current) follows the change in the working volume at the change of the total number of open transactions in the current direction. This means the emergence of bulls/bears imbalance, and the strongest signal is the divergence with the volume indicator.
That is, if the MFI grows with falling volume, the current movement is created by small speculators. Increase in volume and a simultaneous decrease in MFI means a serious confrontation, which will soon result in a breakdown in any direction.
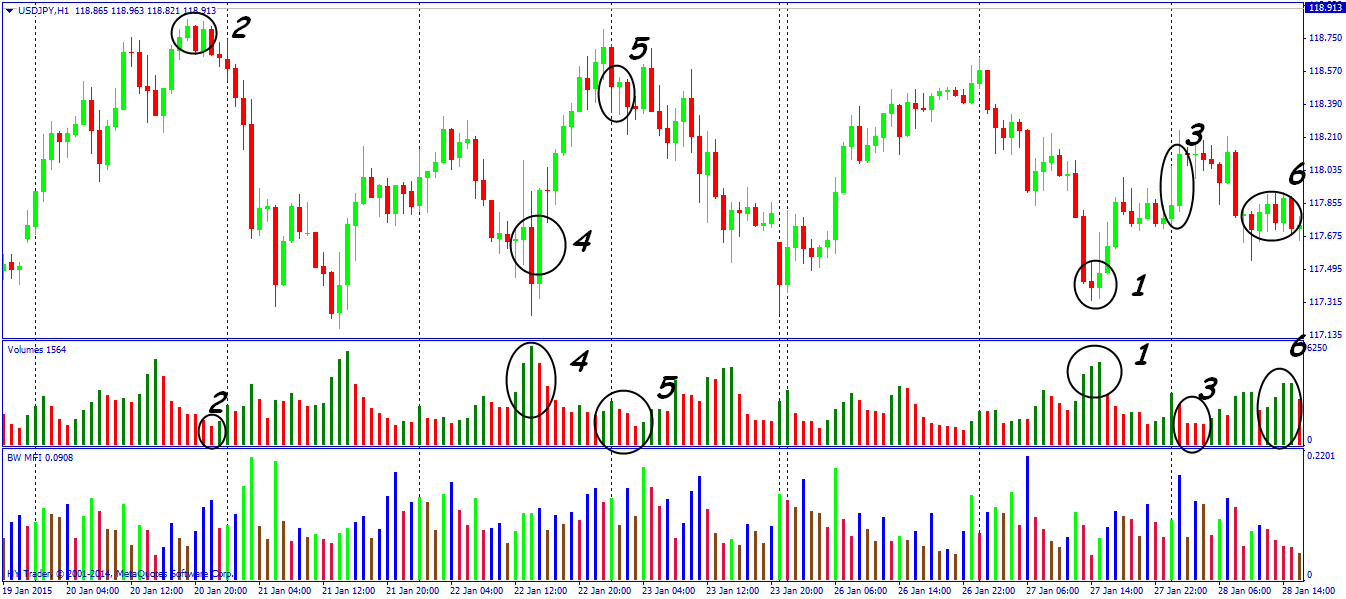
When working with an MFI, you should pay attention to changes in price and volume, so bars generated by the indicator are of different colors.
Green ("strong"): appears at the simultaneous growth of both dynamics and volume. There is a strong trend in the market (direction does not matter), the number of open transactions grows – the bulk goes in one direction. Almost never used as an entry point, simply reflects the presence of a clear direction and allows to control the accuracy of the open positions.
Brown ("dying"): profit taking is ongoing without the intention to open in the opposite direction. The trend strength falls with tick volume. This bar is not used to enter, although it often appears at the max of the first Elliott wave.
Blue ("false"): the existing trend is not supported by new volumes – the big players are trying to "push" the market away from the trend and provoke false price surges, pushing the most nervous players from the market. Wait and do not react.
Pink ("shrinking"): often means the end of the trend, the price slows down despite the growth of the tick volume. The narrow volume of consolidation is formed, then there are two standard options: the continuation of the current trend or reversal.
Important: for the fans of the precise strategy and wave analysis – if the "pink" bar coincided with the "Pin-bar" or "Doji" pattern, is in the current wave and there is divergence on MACD, the probability of a reversal is almost 100%.
Use of the precise strategy on tick volume in real trading
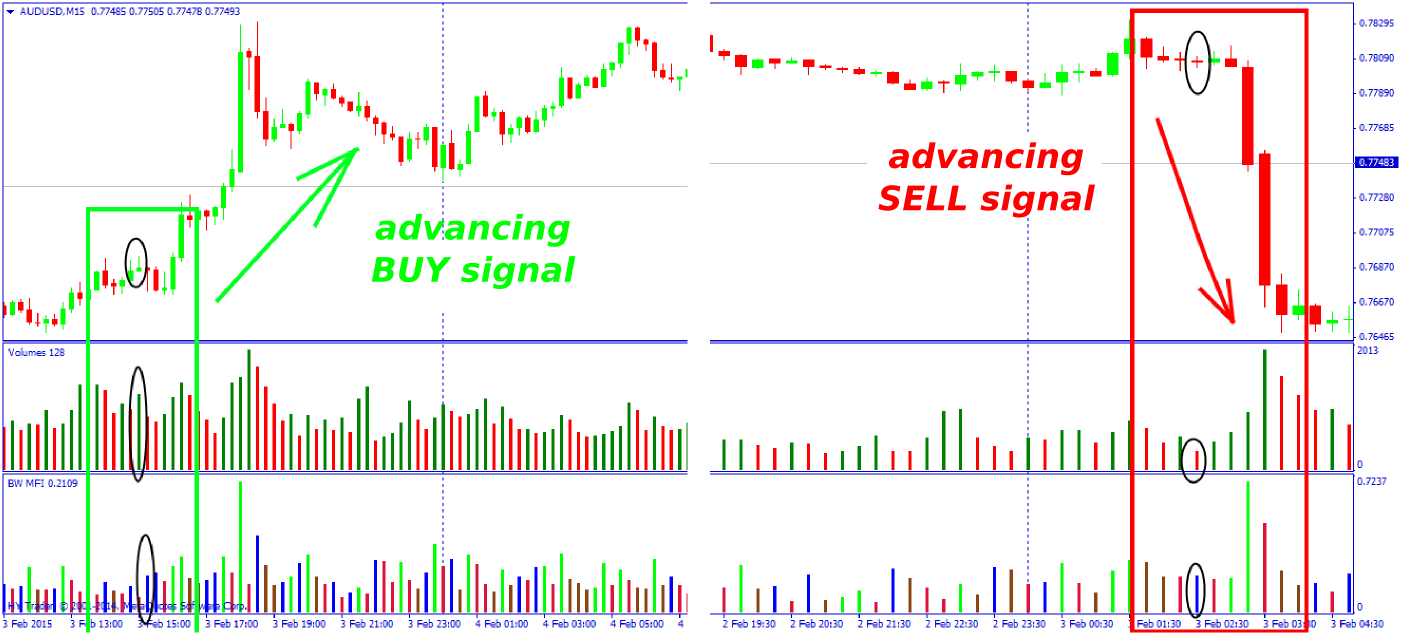
So, the conditions to buy:
MFI indicator is blue, the volume and price candles are bullish and MFI growth is more than 20%. A candle with body bigger than the total amount of shadows is considered to be more reliable.
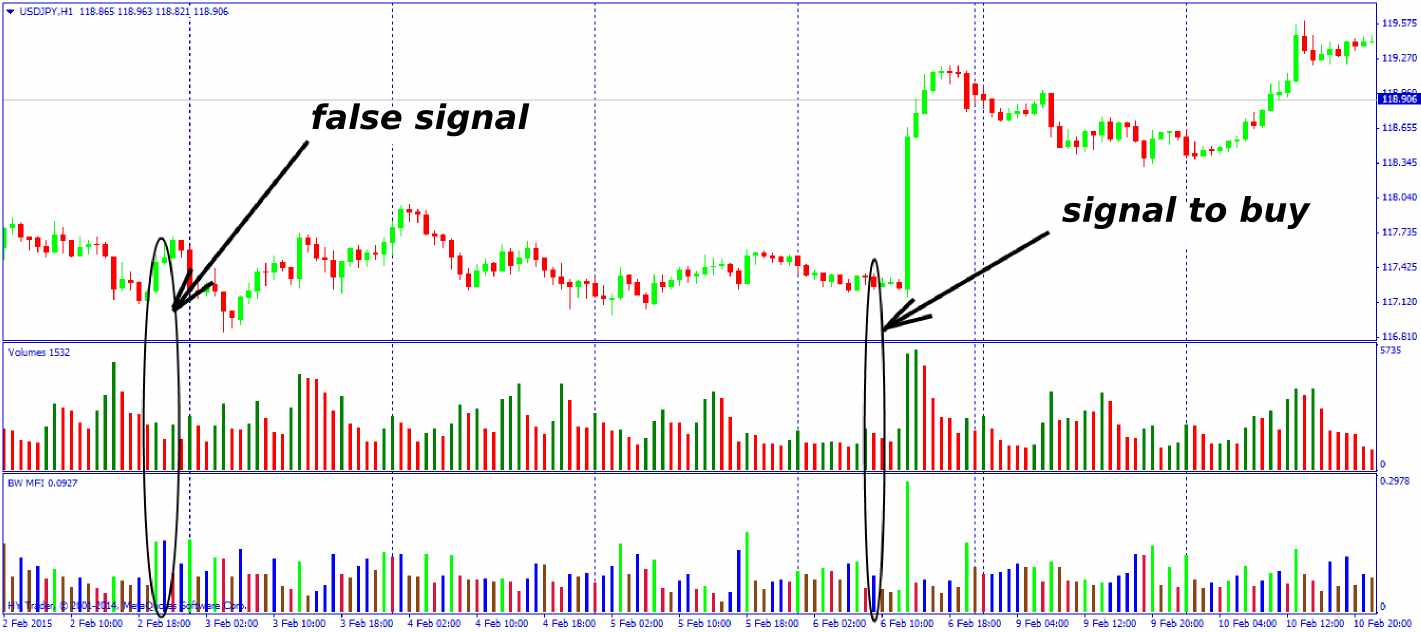
Important: the candle is considered bullish if its lower tail is bigger than the total size of the body and the upper shadow at the negative closing price.
Conditions to open a sell:
MFI indicator is blue, the volume and price candles are bearish, MFI growth is more than 20%.
It is better if the candle has a body bigger than the sum of shadows.
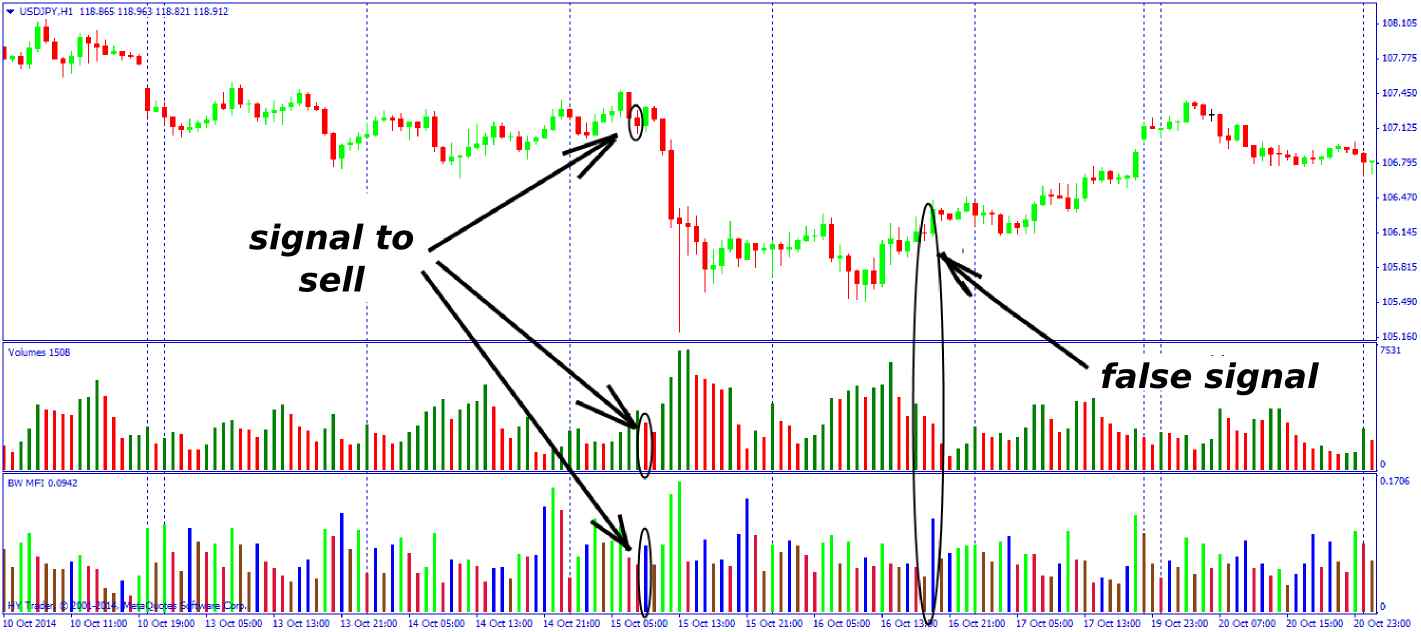
Important: under the precise strategy, the candle is considered bearish if its upper shadow is bigger than the total size of the body and the lower tail at the positive closing price.
Stop-loss is set as follows:
- for a buy: Low price - (High-low)/3;
- for a sell: High price + (High-Low)/3.
Take profit is, as always, twice the stop.
And as a conclusion...
As with any technique based on correlations, the precise strategy on tick volume has a much greater chance of success in the medium- and long-term periods.
The strategy is simple to learn, does not overload the price chart with redundant constructions and is able to provide advancing signals of high accuracy.
Everyone should strive to build their own trading system, but it is advisable that at least small current earnings accompanied the search for your personal Grail. Reasonable profit from trading on volume is provided by the fundamental market law: if you want to earn – follow the leader! Source: Dewinforex
Social button for Joomla