

")
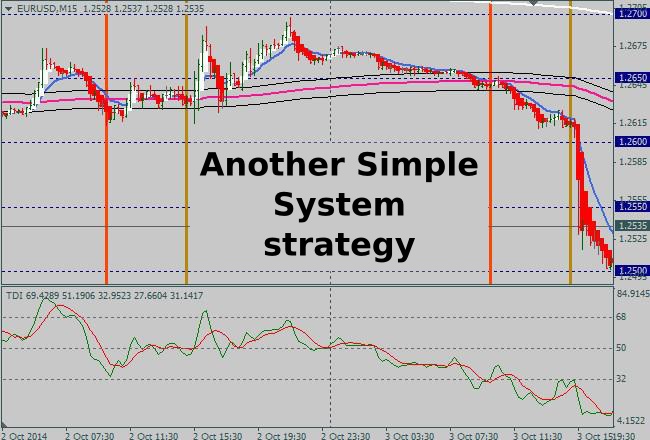
Today we will review another indicator strategy Another Simple System, which first appeared in the vast network back in 2012 and was intended for trading EUR/USD pair using RSI, moving averages and “round levels”.
Of course, we can’t say that this model is the “Holy Grail”, but at a disciplined approach, it is able to generate a small profit and may be a good trainer for novice speculators. Just note that this algorithm is specially created for trading within the day – in particular, for the 15-minute timeframe, so we do not recommend taking it for study to the proponents of long-term trading.
Important organizational nuances include the fact that "average" risks are laid in the system, since at the stop loss of 20 points it is assumed to risk with 2% of the funds in the account on each deal. But in any case, every trader is free to make their own adjustments, and we recommend to start testing on a demo account.
What indicators are used in Another Simple System strategy
As already noted, the algorithm includes several important blocks, each of which is responsible for specific functions, and the first of them is RSI presented in the original system not in the classical version, but as the TDI indicator, which is as follows:
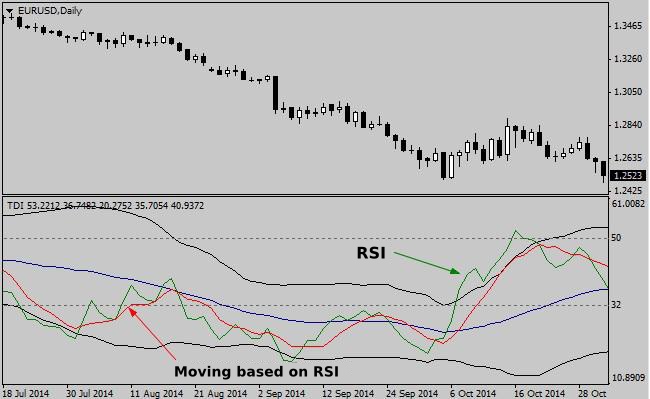
The green line in the basement window is the value of RSI (with the period of calculation = 13), the red line is the moving average built on the values of RSI (period = 7), a channel with black borders and the central blue line is Bollinger bands, which measure the volatility of the strength index, but today they are not needed. The following indicators are presented in the main window of the chart:
- EMA (800) – white exponential moving average;
- EMA (200) – pink exponential moving average;
- EMA (10) – blue exponential moving average;
- Heiken Ashi – red and white candles used as an auxiliary filter (Another Simple System strategy can work without them);
- Round Numbers 5 digit – the indictor displays on the blue levels on the chart, built on a “round” prices;
- JF_TradingTimes – displays time of the trading sessions, in our case – the opening of the London trading site (orange vertical line) and the US (khaki line).
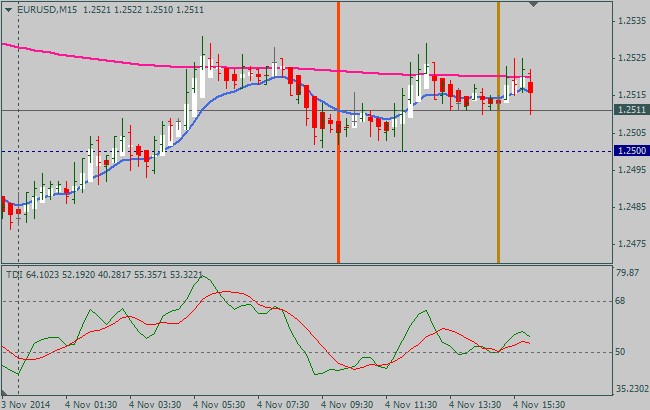
Of course, all custom indicators listed above may be substituted with analogues, especially as there are now more than enough of them out there, so you do not even need to look for a specific pattern. After installing all the components, the working window will look as follows:
Another Simple System strategy in practice
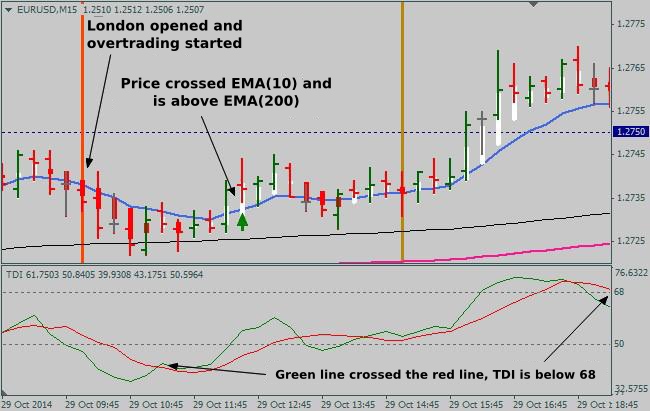
Despite the fact that the authors have dubbed their development “elementary”, which anyone can deal with, in fact all is not as easy as it may seem, but first things first. First of all, let’s consider the basic rules for opening the orders to buy (opposite rules apply for orders to sell):
- Price is above the EMA (200);
- The red TDI line is below the horizontal level 68 (to sell – above 32). We will explain the meaning of these levels below;
- Green TDI line crossed the red upwards;
- Price crossed EMA(10) upwards.
Now a few words about the levels on the TDI. In fact, the logic of their construction and interpretation is no different from a similar operation on the RSI, for obvious reasons, but we’ll explain for beginners. When TDI is above 68, the market is overbought and the correction may begin at any time, so buying at this situation involves risk. If the TDI entrenched below 32, we can talk about overselling, i.e. there are too many sellers (which is most frequently observed at the bottom), so it is dangerous to join them.
Of course, such estimates are statistical in nature, i.e. if you take a sample of situations, in most cases, after reaching these levels the market started to correct, so the real oversold state (which is characterized by volume, delta, etc.) is out of the question.
Filters of signals, as already noted, somewhat complicate life, as the authors recommend to refrain from entering into transactions around EMA(200), but don’t give specific quantitative criteria of that “around”. To eliminate the uncertainty, we recommend adding two levels of +/-7 points to the main line, for example:
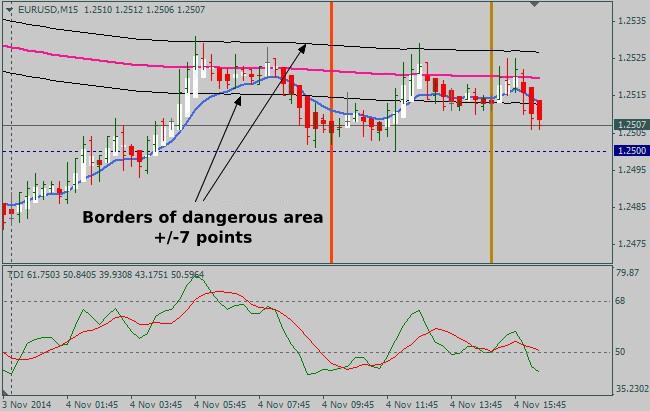
As you can see, a potentially dangerous area where the Another Simple System strategy can generate false signals is completely neutralized, i.e. if a pattern has formed between the additional EMA(200) levels, just do not pay attention to it. A similar function is performed by “round” blue levels near which it is also not recommended to open orders, it’s better to wait for a rollback or breakthrough.
But that's not all: after the opening of London, the author recommends to wait 15 to 30 minutes (1-2 closing candles) to let the market determine its direction, but some “experts” ignore it, arguing that many true signals are simply discarded. In our opinion, in this case the author is right, as in the opening of the main European platform the market sees incoming volumes that lead to false alarms.
The purpose of use of Heiken Ashi candles remains unclear from the author's topic (which is more than 1,000 pages long), but it is obvious that the algorithm of their application is no different from the classical description, i.e. you must wait for the white candle to buy. The figure below shows an example of a situation optimal for opening an order to sell:
Maintenance of positions and comments
Another Simple System strategy involves the installation of a fixed stop loss of 20 points, but the user can optionally enable a trailing stop – the tests showed that the result does not become worse at that. As for the take-profit, the situation is somewhat more complicated, since there are two possible scenarios:
Set a fixed take of 20 points, i.e. the ratio of profit/risk is assumed as 1 to 1. In our opinion, this option is unpromising, because a lot of false alarms form in today’s market;
Close the order at the reverse intersection of the green and red TDI lines – the best option, since, on the one hand, it allows you to save on stops, and on the other, it makes it possible to squeeze out the most from the profitable deal.
It is also recommended to take profits at the touch of EMA(200), but this recommendation is useless, since up to this point the TDI will form the reversal signal, so when accompanying the positions, you are recommended not to disperse the attention to the entire set of indicators, the only exception may be the Heiken Ashi indicator, which indicates a reversal of the trend by its color change.
Summarizing, we can note that the system reviewed today does not differ from its peers, as we can name at least 4 algorithms offhand, which use a similar logic (the intersection of the lines on the RSI plus “movings”), filter on trading session is also no surprise – it is common practice. The only advantage of this strategy is a good optimization for intraday trading (sufficiently reliable parameters for the euro are picked up). Source: Dewinforex
Social button for Joomla