

")

This article will review a Profit System strategy. This strategy is based on moving averages and a derivative indicator, Parabolic SAR. The trading strategy is mechanical, i.e. the trader must open and close deals on his own, as well as set the levels of take-profit and stop-loss. Below we’ll review the cases when it is worth to buy and when to sell. As for the scope of the considered strategy, it can be used on any timeframe and with any financial tool (currency pair).
As we have said, the Profit System strategy uses the Moving Average and the Parabolic SAR indicators. First of all, you should customize the indicators and change their internal values:
For the Moving Average, select Exponential type, the period is set to 10, apply to the closing prices, and we chose a red color to show it on the chart. Next moving average has a period of 25, the rest parameters are unchanged, and the color is blue. The third exponential moving average has a period of 50 and a yellow color. The final touch is the setup of the Parabolic SAR indicator with default settings.
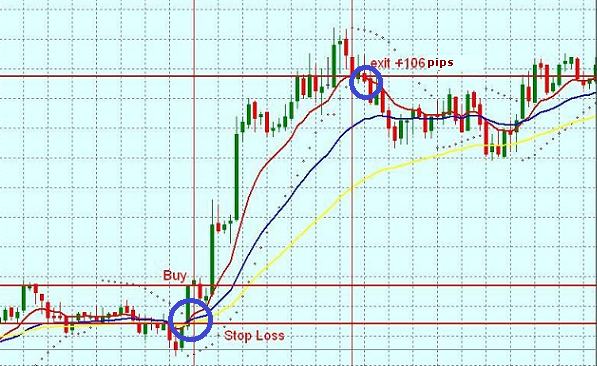
Now that we are done with the settings, we can proceed to the signals given by the Profit System strategy. First, let’s take a look at the order to buy. A signal to open a position to buy is the crossing of the fastest moving average (red, period 10) and other moving averages, i.e. yellow and blue, upwards. An additional confirming signal is the value of the Parabolic indicator, as it should be below the price line to open the order to buy.
The orders to sell are opened when the 10-period MA crosses the moving averages with periods of 25 and 50 downwards. That is, the moving averages should be placed in the following order: yellow, then blue below it, and the red below them. The Parabolic SAR must be above the price line to open short positions.
However, there are more signals given by the Signals Profit system. There are several rules that you must follow for successful trading. The trader should compare the location of the Parabolic with the smaller timeframe. For example, if you are trading on the hourly chart, the Parabolic indicator should be compared with the 15th chart: their location must be the same. One of the main rules of the strategy is correspondence of the Parabolics of the larger and smaller periods.
Exit from the position is quite simple: at the reverse crossing of the slow moving averages and the fast one (the red one). Level to set a stop-loss is also determined easily: it must be located behind the yellow moving average – if you buy, it should be below the MA 50, if you sell – above it. Since it is a trend trading, it is reasonable to use a trailing stop or move the stop-order manually. Consider the behavior of the price in relation to the moving averages. If the price crosses all three moving averages lines, you need to exit the position, regardless of its direction.
In addition to the default settings, there are some alternatives. The periods of the moving averages can be replaced by 25, 50, 100, while staying with the same type, EMA. There is also a new signal, the breakout of the moving average with a period of 100 by the price, and you need to open in the direction of the breakout. Usually an average profit ranges from 50 to 100 pips per trade, so don’t be very greedy and don’t expect superprofit.
Profit System strategy is not as simple as it seems at first, but it brings good profit to traders who have mastered it. It’s easy to grasp its rules, but to succeed you have to follow them. Source: Dewinforex
Social button for Joomla