

")
Today’s article will focus on the unusual and to some extent unique trading strategy. The strategy dubbed “Rainbow” has already gained quite a lot of popularity among traders – not only those who trade short-term, but also among long-term ones. The strategy is based on the Rainbow indicator, which looks like a rainbow – this indicator is very good-looking. But it’s not just about the beauty – the Rainbow indicator is very efficient and shows good results.
Both professional and novice traders can use this indicator. Any currency pair can be traded – the indicator is universal. Experienced traders have probably already guessed that all these nice lines are moving averages. The only difference lies in the fact that they are arranged in advance and are an integral unit. You have to admit that to apply 50-70 lines every day is not an easy task.
Let’s analyze the Rainbow indicator in more detail. The indicator uses 5 colors: yellow, blue, green, red and pink. Each color consists of several MAs of exponential type. To be precise, the composition of the colors is the following:
Yellow ЕМА: 2,3, 4, 5, 6, 7, 8, 9, 10, 11, 12, 13, 14, 15;
Blue ЕМА: 17, 19, 21, 23, 25, 27, 29, 31, 33, 35, 37, 39, 41;
Green ЕМА: 44, 47, 50, 53, 56, 59, 62, 65, 68, 71, 74;
Red ЕМА: 78, 82, 86, 90, 94, 98, 102, 106, 110, 114, 118, 122;
Pink ЕМА: 125, 130, 135, 140, 145, 150, 155, 160, 165, 170, 175, 180, 185, 190, 195, 200.
A logical question follows: why are there so many moving averages? The matter is that they allow to see the full depth of the market: long-term, medium-term and short-term trends. Such composition also enables any trader to use the Rainbow indicator.
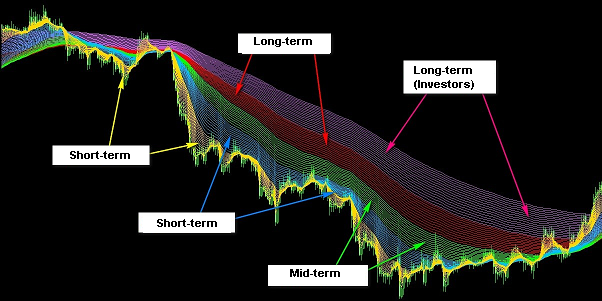
Yellow moving averages indicate short-term trends. The behavior of this MA will first of all be interesting for pipsers. Blue MAs indicate the area for short-term traders’ activity – those who trade intraday. Green MAs characterize medium-term trends. Red lines show the behavior of long-term traders, and pink – that of the investors who hold positions for several years.
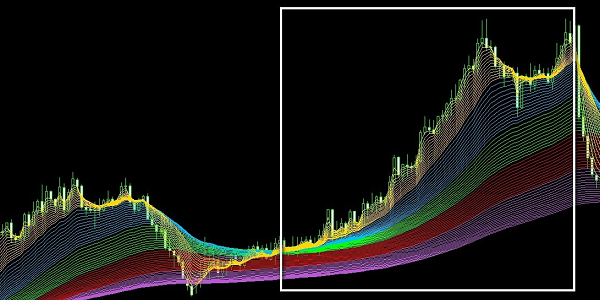
The indicator is a trend one, so selling and buying is quite easy. The most powerful and accurate call to action is formation of a unidirectional movement of all moving averages. If the moving averages are located in the following order: yellow, blue, green, red and pink, then we should buy. Simply put, in such cases both speculators and investors open orders to buy, thus forming a bullish trend. When the colors of the lines come in a reversal order, it is a signal to sell.
Buying:
Selling:
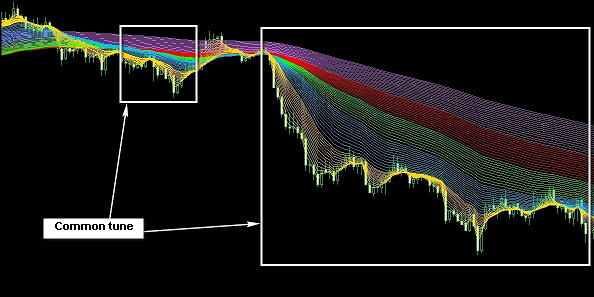
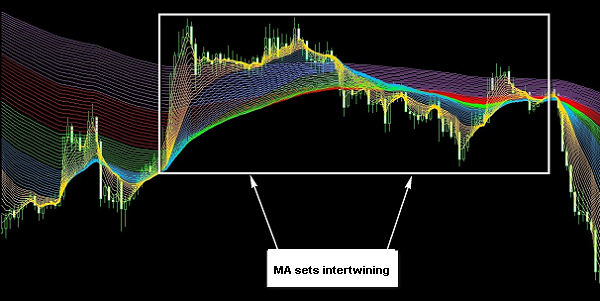
It often happens that the MA lines don’t have a common dynamic and are intertwined. Thus, the indicator shows the presence of the price range – sideways trend. Since the indicator under consideration is a trend one, its efficiency drops at the moments of a flat, and the traders are advised to sit still and avoid opening positions. Remember that lack of position is also a position.
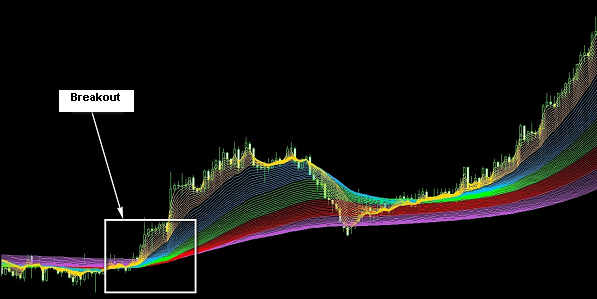
The Rainbow trading strategy also allows to effectively trade the breakouts. Moving averages will help to determine whether there is a real breakdown or a false one. The picture below shows that the price after going down has rocketed and crossed all MAs. Fast MAs also started to cross, but we are watching the slow ones. To confirm the signal of a reversal, the red and pink lines should cross. That’s exactly what happened in the end.
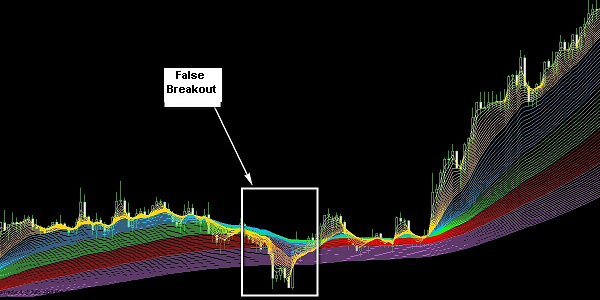
This image shows a false breakout. Despite the fact that the price has crossed all MAs, including the slow ones, the MAs haven’t replotted. In such cases, it is better to avoid buying.
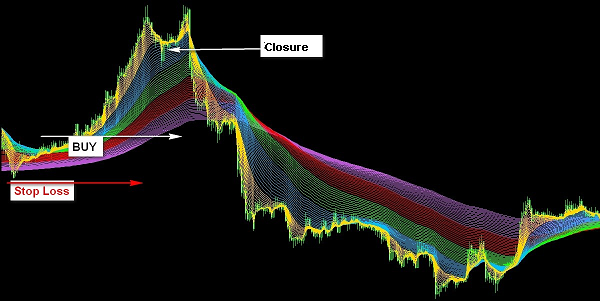
Consider the example of buying with a chart. We see that all the lines begin to tend upwards and slowly line up in the right position to us. The trend is our friend and we will follow it. When all the MAs take up their positions (line up in the order), you can open a deal to buy. The deal is closed if the price rolls back to green or blue areas. Protective stop is put beyond the pink line, which is a great place for the previous minimum.
As you can see, the Rainbow indicator is very efficient, but at the same time simple and easy to learn. You can use it with any currency pair, and the time interval can also vary (it is recommended to start with 1H).