

")
Trading on the foreign exchange market – like on any other, stock or commodity, market – always implies constant cash flows. There are always people on the market willing to buy or sell, and MFI indicator allows a trader to see the intensity of the incoming or outgoing cash flow in certain financial instrument – stock, currency, future or commodity. In simple words, when prices rise, the cash flow increases. On the contrary, when the prices fall, the cash flow shows negative dynamics.
MFI indicator by its appearance and operating principle resembles a well-known RSI, a technical indicator. Its chart also displays a line which moves from the lower border to the upper border and back. Indicator values range from zero to one hundred. But what is the difference between MFI indicator and RSI then? MFI in its chart takes into account one important factor that RSI doesn’t – a volume value. Thus, the flow indicator is deeper in its significance and more complicated.
Practical use of the indicator is also very similar to the RSI indicator. The first thing a trader can determine using the MFI indicator is that the market is overbought or oversold. The operating principle is known to everyone. When the indicator line is close to the top of its border, above the level of 80, for example, they say that the market is overbought. In this case, a trader should expect a market reversal or correction. If MFI indicator is in the lower range, below 20, this situation indicates oversold market to the participants. Price chart can turn into opposite direction – in this case, stop falling and start growing.
This is the basic information MFI indicator bears. But you should remember one important thing: if the indicator shows overbought or oversold market, it doesn’t guarantee a market reversal 100%. It is not unusual that the currency pair continues to grow, and for a long time, while the cash flow indicator shows oversold or overbought market all the time. It is therefore important to understand the current situation in the market and to weigh the probability of a reversal. It is probably better to say that this indicator works best in the sideway and bandpass market conditions, just like the RSI.
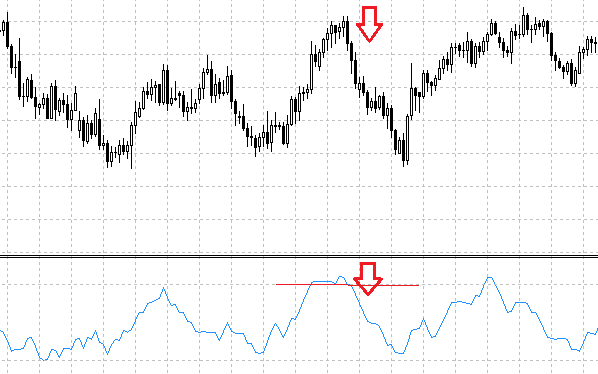
But the challenges of the cash flow indicator don’t end here. Besides the common oversold and overbought conditions, the indicator can provide a trader with more serious, strong signals. We're talking, of course, about the discrepancy between price chart indices and the indicator chart; in other words – about the divergence. This is possible because the MFI indicator is an oscillator – however, a trader gets its values late, because like all oscillators, it is calculated on the already received data.
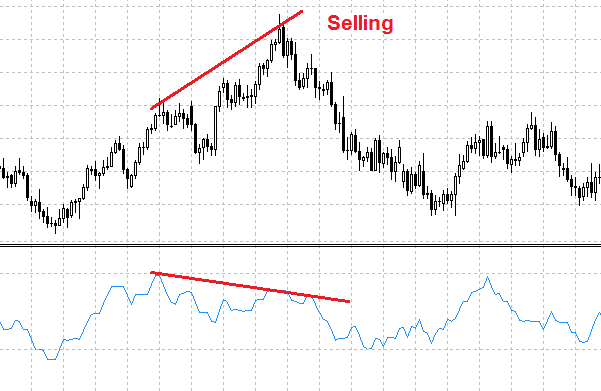
Divergence is a strong signal, and using a flow indicator, we can detect it. The analysis principle is simple: you have to find, for example, two vertices on the price chart and take a look at the indicator data. If indicator decreases in the area of two increasing price vertices, then it is a signal to sell. On the contrary, the signal to buy is two vertices on chart with the second one being smaller than the first one, coupled with the increasing indicator: here you can look for an entry point to buy.
As you can see, the MFI indicator has broad functionality. Being inherently an auxiliary analysis tool, it works well in combination with other indicators, such as moving average. All traders are recommended to pay attention to this indicator and test it in action.