

")
This article will review not a trendy and sophisticated indicator, but rather a technical analysis tool from the standard package of almost any trading software. Intended for use on commodity markets, and later having become universal, CCI indicator is a quite popular trader’s assistant in market battles. Today, this indicator is used on many markets, from bonds to futures.
This versatile and user-friendly tool was developed in the early 80s by Donald Lambert. CCI (Commodity Channel Index) indicator is a line that oscillates in a certain diapason (+/- 200). The CCI can help estimate the strength of the current trend, turning points, extremes, etc. Thus, the indicator can be attributed to the class of oscillators. You can hardly find any textbook on technical analysis which doesn’t mention the CCI indicator. According to experienced traders, despite the fact that CCI is out there for a while now, the capabilities of this tool in the trading systems development are still not fully understood.
Using the CCI
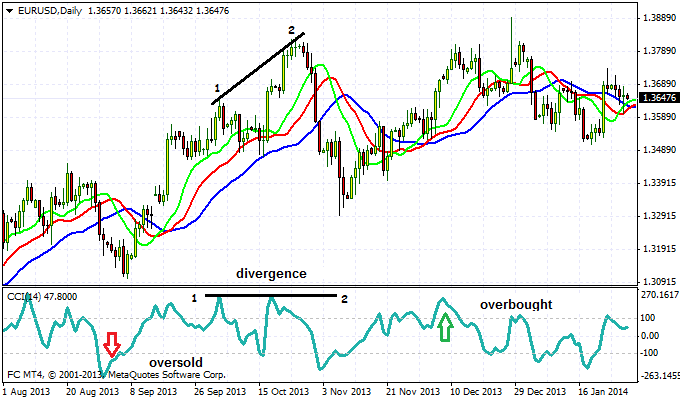
If you drag the CCI indicator from the MT4 Navigator window to the EUR/USD chart, you will see that the period set by default is 14. A trader can change this setting at will or as part of the trading system optimization. If you reduce the calculation period, the indicator will be more sensitive. If you increase it, the situation will be reversed: the CCI will be more inert and less likely to deviate from the average values. The figure shows a EUR/USD-Daily chart and the indicator window with period of 14. The boundaries of the diapason are +100 and -100 marks, and the broader ones: -200 to +200. If the indicator is beyond the +200/-200 diapason, it indicates the extreme overbought/oversold market. There are many different interpretations of the indicator and the relevant trading approaches. Here are some of them.
Crossing Diapason Boundaries
The strategy here is the following: when the CCI line reaches an oversold area, you need to wait until the line crosses the bottom -100 mark upwards. This will be a signal to buy. If you open a short position, the situation is similar: you have to wait until the indicator line crosses +100 mark downwards.
Zero mark crossing
The principle here is similar to the above-described strategy, but the signal line is zero mark in this case. That is, if the CCI line plunged into oversold area and then rushed up, upon crossing the zero mark a long position on the selected instrument is opened.
Divergence
All the oscillators can give this kind of signals. When the difference between the signals from the market and the dynamics of the indicator curve becomes too obvious, it may open decent speculative opportunities. For example, when the price forms ascendant extremes in the trading tool chart, and the indicator line forms downward or the same level ones, it can be an argument for taking a short position, because quite often this divergence will indicate local overheating.
Each trader chooses the way to use the CCI indicator for themselves. You can try different periods and timeframes, search filters for indicator signals, or, vice versa, use it as a filter. As a rule, a separate indicator is rarely able to provide a high frequency of occurrence. To reduce the likelihood of false alarms and to optimize the trading method as whole, it is recommended to use this indicator in conjunction with other technical analysis tools.
Social button for Joomla