

")
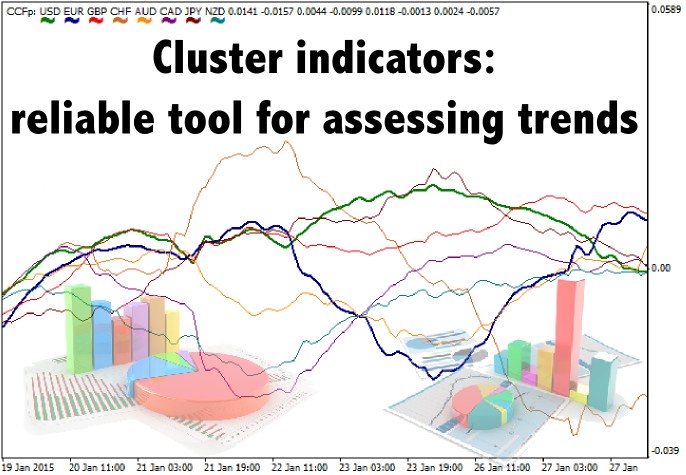
Traders buy and sell assets for currency in financial markets, and while there is no problem in assessing the value of the instrument on the commodity or stock exchange, Forex has got special cluster indicators for this purpose.
In this case, cluster should be understood as a set of currency pairs that serve as a base to calculate the dynamics of each individual currency. A cluster can be represented as a polygon, each angle of which corresponds to a certain currency, while the sides and diagonals form currency pairs. The following figure shows an example of such a cluster:
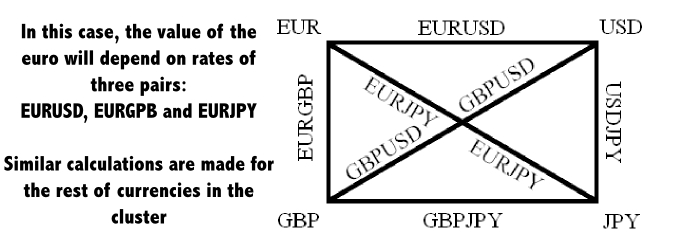
If we are interested in the objective value of the euro, we will have to calculate it based on the rate of three pairs: EUR/USD, EUR/GBP and EUR/JPY. A similar operation is made for the other three currencies ¬– to get more precise estimates, you can add a few more "angles" to the cluster (a similar approach is also implemented in indicators).
Thus, the cluster indicators filter out various information noise and display only the overall dynamics of a particular currency. Speculations on the decisions of central banks can be an example, because if the US dollar falls in price relative to the Swiss franc on SNB decision to increase the base rate, this does not mean that the dollar becomes objectively weaker – on the contrary, it could rise to the euro and the yen in the meantime.
In this regard, the clusters resemble currency indexes, but while you need to select the optimal weight of each pair in the index to construct the latter (because of the different value of one point), the cluster analysis only takes into account the relative exchange rate fluctuations with respect to each other (in other words, the dynamics is expressed as a percentage).
Trend cluster indicators
In today's publication we will talk about the development of a user from MQL5 portal under the nickname “Simon Simon” – in fact, they are called “Simon indicators” in slang. We could choose to describe other methods, but the development of this particular programmer became the starting point for the creation of later cluster modifications and clear "plagiarism".
So, today there are two trend-tracking indicators, the first is called CCFp and shows the relative deviations of the 8 major currencies from the balance line, while the second (CFP) automatically detects the currency pair upon installation on the chart and displays the trend only for this instrument:
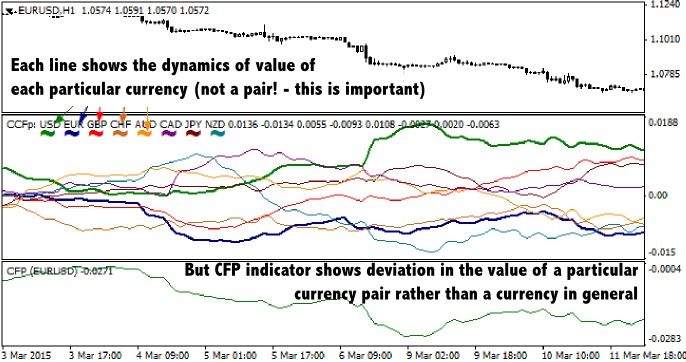
As the author notes, trend cluster indicators do not give signals to buy and sell, they only assess the balance of power in the market and can be used by traders in the manner similar to CCI, i.e. you should search for signals to buy if the indicator is above the balance line (zero), and sell if it is below. The mentioned indicators are set using the same variables:
- MA Method – type of a moving average used to eliminate noise;
- Price –price type, which is also specified by digits (0 – close, 1 – open, 2 – high, 3 – low, 4 - median, 5 – typical, 6 – weighted);
- Fast – period for calculating the “fast” moving average;
- Slow – period for calculating the “slow” moving average.
- The list of currency tickers – here you can select a list of currencies in the cluster using the true/false command.
On the other hand, if the indicator line is above (below) zero for a long time, this state can already be interpreted as overbought (oversold), but to be honest, it is very difficult to capitalize on it, because you will need to gain a position on all cluster pairs at the same time by the minimum amounts and without stop-losses, so there are the following general scenarios (on example of CCFp):
- Indicator currency is near the balance line – the market is flat, it is recommended to refrain from entering into transactions;
- Line crossed the zero mark upwards – probably, a strong bullish trend is emerging;
- Line crossed the zero mark downwards – the likely beginning of a strong bearish trend;
- The indicator is above the balance line and begins to decline – correction is close, it is recommended to exit from long positions;
- The indicator is below the balance line and begins to grow – it's time to take profits on short positions.

Signal cluster indicators
The following two indicators, CCp and Complex_pairs1, are very similar to the trend ones, but they react to changing trends more quickly and can therefore be used to search for specific entry points. This is due to the fact that CFP and CCFp take into account the situation on multiple timeframes, and signal models investigate the market only on the chart where they were installed by the user.
Similarly to trend algorithms, the pulse cluster indicators can display dynamics both on one pair (this function is assigned to Complex_pairs1) and on the whole market (CCp copes with this task). However, it should be noted that Complex_pairs is actually a simplified version of CCp, as it reflects the difference between the rates of change in value of the currencies in the particular pair, so CCp is much more informative:
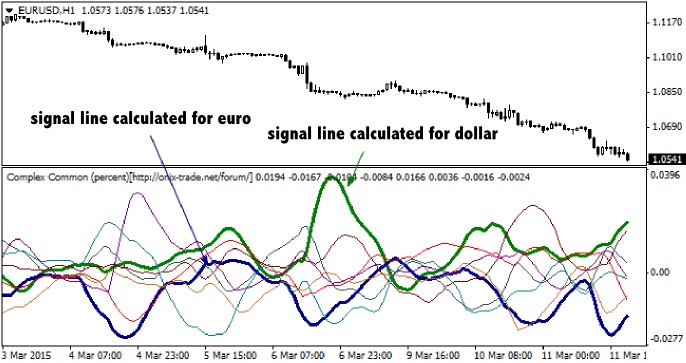
In this case, you can try to buy and sell the entire portfolio of currency pairs included in the set of the cluster from the limit boundaries of fluctuations. The only caveat is that the range limits will have to be pre-calculated using statistical techniques or just making a rough estimation. Another reliable signal to open an order may be the intersection of lines characteristic of the currencies in the pair. Consider the example of the EUR/USD pair:

To assess the situation objectively (to make the indicator use an extended list of pairs for calculation), we allowed the algorithm to take trends in all major currencies into account by selecting the command “true” in front of each ticker in the settings. By the way, you will need to perform one more action to avoid confusion – make all lines transparent, except the blue (EUR trend) and green (USD dynamics).
It can be seen that the EUR/USD pair tends to grow when the blue line is above the green, but if the opposite is the case, in most cases the European currency depreciates against the dollar. The conclusion is obvious – the intersection of the lines should be used as signals.
Decent results are also obtained in the prediction based on the markup of trend lines and channels on the CCp indicator, but if you buy the "undervalued" pair relative to the entire cluster (which deviates from the general trend stronger than others), as some traders on the forums recommend, you can fall into drawdown for a long time.
Cluster indicators and their features
Given the fact that these indicators are written in MQL4 language, it is necessary to take several features into account. Firstly, cluster indicators can display a maximum of eight lines in the basement window (this is a feature of the engine), so you won’t be able to cover the entire market and will have to go with the major currencies. Secondly, the terminal may freeze for a few seconds during strong movement. The last nuance is that you will have to update the chart from time to time to ensure the lines are displayed correctly.
Social button for Joomla