

")
 Beginner traders often can meet such a thing as volatility in market reviews and comments on the current situation. Before we describe the volatility indicator and its properties, let’s see the definition of volatility itself. Volatility is a kind of statistic value that characterizes the ability of prices to change. This notion is a fundamental notion for risk managers and financial analysts. The higher the volatility is, the higher the risks are when one opens position on a specific instrument, and vice versa.
This article will consider the volatility indicator ATR (Average True Range). This indicator is used to determine the average diapason of variation of a particular financial asset at a specified time interval. The ATR use sometimes greatly simplifies the trader the process of decision-making when he or she places protective stop orders for open positions.
The volatility indicator is calculated quite simply. Firstly, the True Range (true range) is calculated. At any time, a calculation of three values is conducted, and the value of the TR is always equal to the value of the quantity, which value is greatest at the moment. Specifically, they are:
- Amplitude, which reflects the difference between the maximum and the minimum values;
- A difference between Close last time since the last period and the current maximum;
- A difference between Close last time since the last period and the current minimum.
Thus, the values of TR are in fact an array of data that is constantly updated with new values. The indicator parameter specifies the number of time periods that will be used for the ATR calculation. But the ATR itself is a moving average True Range. The image below shows the indicator values with a period of 14 (EUR/USD - Daily).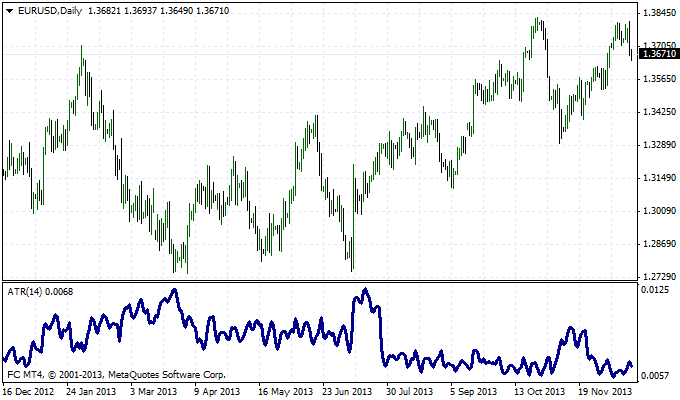
Using the ATR volatility indicator
An ATR growth indicates the growth of market volatility and increased risks associated with it. As has been already mentioned above, the volatility indicator ATR helps the trader to select the optimum values for the stop-loss. If, for example, the ATR value is low and close to the minimum for a certain period of time, the traders are better to place tight stops. Conversely, in the case of high ATR values, the order should be placed as far away as possible from the current price, as the probability of inadvertent operation is great.
The ATR is used as a filter for confirmation signals to buy or sell at the break of support or resistance as well. When the market exceeds its important levels, as a rule, it shows the volume growth and a rise in volatility. If the breakthrough is false, then volatility will not going to happen.
Thus, the ATR volatility indicator is an instrument to determine the phase of the market state. It is not able to identify the direction, but it is able to indicate the periods of high and low risks. You can experiment with a period and find the most suitable value for a specific trading approach to find the optimal indicator’s parameters. The ATR is included in the standard package of MT4 indicators.
Social button for Joomla