

")
Any correlation indicator has the only goal – to characterize the dependence of prices of two or more instruments using the relative value. Direct implementation and graphical representation of such algorithms can vary significantly depending on the objectives pursued by a programmer or a trader. It is impractical to review in detail what the correlation is, so let’s go straight to the peculiarities of specific algorithms.
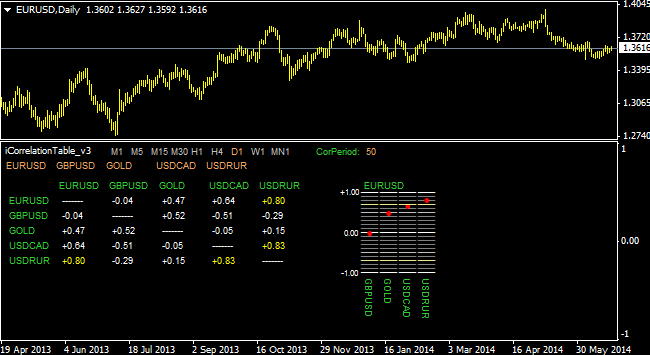
iCorrelationTable correlation indicator can undoubtedly be called the most popular and useful of the group, because, first of all, it is very flexible in configuration, secondly, displays detailed information compactly in the same window, and thirdly, even with a long calculation period and many tools used it doesn’t hang up the terminal. The figure below shows an example of the working window:
There are some nuances in the operation and setting of this indicator. First of all, it is an opportunity to set an unlimited number of financial instruments analyzed. To do this, you need to create a text file called «Symbols», register appropriate tickers in the column order, and save it into the MQL4 → Files directory. To force the indicator use only the instruments from the list, you need to set SymbolsListVariant parameter value equal to 2 when you apply the code to the chart. For the above example, the setting is as follows:
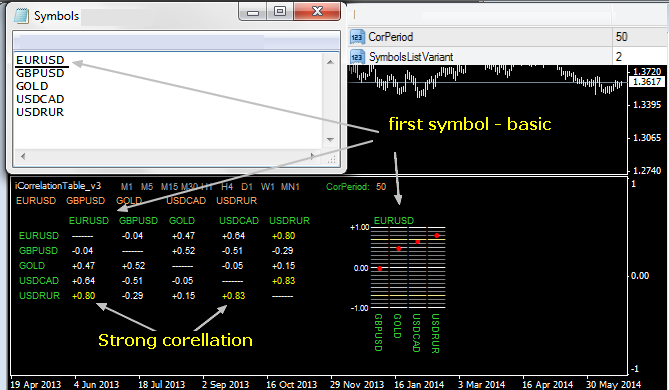
In this case, strong correlation can be observed between USD/RUR and USD/CAD pairs, and it is caused by the influence of the U.S. dollar rate and the oil market. It should be noted that this table is only reasonable to use during the detailed study of the market, on the long periods, and in conjunction with fundamental analysis, while it carries no informational value for intraday trading.
Correlation indicator for intraday trading
Methods on convergence/divergence of the correlated assets are frequently used for active speculation. Respectively, many indicators were invented at the time to ensure a statistical advantage. Unfortunately, most of them are useless in the foreign exchange market, because when trying to catch the “convergence”, the trader trades a synthetic instrument – for example, when buying a EUR/USD pair and selling GBP/USD, we actually get an operation equivalent to buying EUR/GBP.
Therefore, if you do not stray too far from the subject of the currency market, we can note that similar strategies for precious metals can be interesting. In this case, a good helper is the correlation indicator OverLay Chart, which simply builds an additional chart of the correlating tool on the main screen – in particular, the working chart for gold will be as follows:
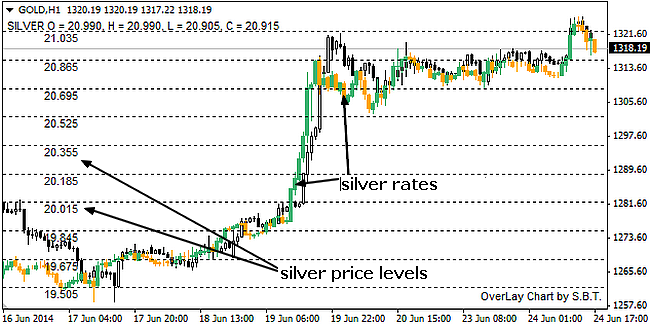
Despite the fact that the example shows an “hour", it is recommended to use these solutions at small timeframes, since the probability of catching the short-term movement on the delaying metal after the pulse on the more active one is high enough. In addition, in order to trade using these algorithms, it is necessary to know the nature of working instruments, i.e. have experience, since no auxiliary lines or arrows, which are so important to the beginners, are provided in this case.
Thus, summing up the results, we can draw several conclusions: first of all, a classic correlation indicator which calculates the coefficient is more beneficial in the management of a portfolio of instruments, i.e., in the medium term; and secondly, the convergence/divergence as a whole is not as useful on currency pairs, but if such a strategy doesn’t lead to the forming of synthetic instrument available for trading, you can successfully scalp.
Social button for Joomla