When educating new traders, many teachers and experienced speculators forget to mention that the indicators for beginners must meet several criteria, the most important of which being ease of setting and simplicity of formulas.
Ease of setting means excellent optimization of the indicator by developers, in result of which the trader does not need to configure various factors and variables. Speaking of the simplicity of formulas, there is no need to explain, as the first steps in trading should be very clear to anyone. Taking these assumptions into account, let’s move on to a description of several algorithms that can be very useful for learning.
Signal indicators for beginners
Perhaps, almost all the newcomers are familiar with the classic version of "stochastic", and there are enough reasons for such popularity, because it is one of the most informative and simple indicators that shows good results on all timeframes and chart types. But it has one drawback: many signals remain unfinished, since it is impossible to track all of them. Stochastic Cross Alert SigOverlayM indicator (hereinafter SCASOM) solves this problem.
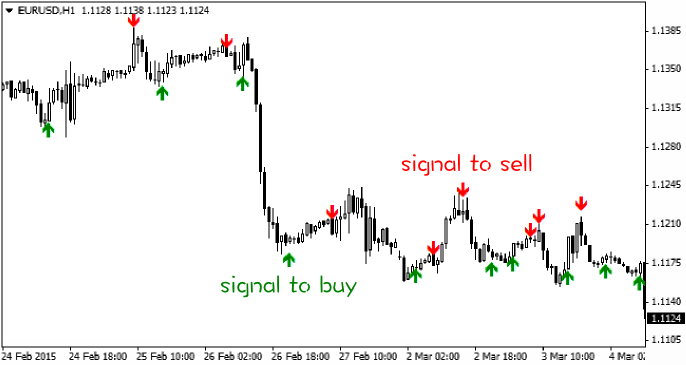
It determines the optimal point to open orders using stochastic and displays them on a chart in the form of red and green arrows – the trader only needs to make a deal in the direction of the prevailing trend. Just like all indicators for beginners, SCASOM is easy to configure, it will require the following parameters:
- KPeriod, DPeriod and Slowing – standard settings of regular stochastic;
- MA Method – select the method to build Moving Average;
- Price Field – select the type of prices (Low/High at 0, Close/Close at 1);
- Over Bought Level and Over Sold Level – limits.
Thus, it is a usual stochastic oscillator, the signals of which are easier to follow. Moreover, using additional variables SoundON and EmailON, the user can enable sound alerts (we recommend always set “true”) and notifications by e-mail (for most traders it is a useless addition, so you can leave “false”).
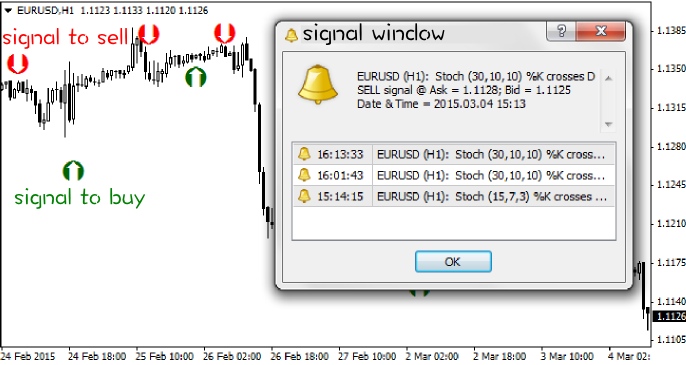
Another signal indicator called Stoch Crossing has a similar function. Its signals on the chart are represented as similar arrows, and the settings also list the main parameters of the stochastic oscillator, but unlike the previous indicator, it has an alarm window that appears after each signal.
Comprehensive indicators for beginners
In recent years, the following trading method is gaining popularity among novice speculators – a set of standard indicators is automatically analyzed on special resources, and then the number of signals to buy and sell is compared, and the most likely direction is identified.
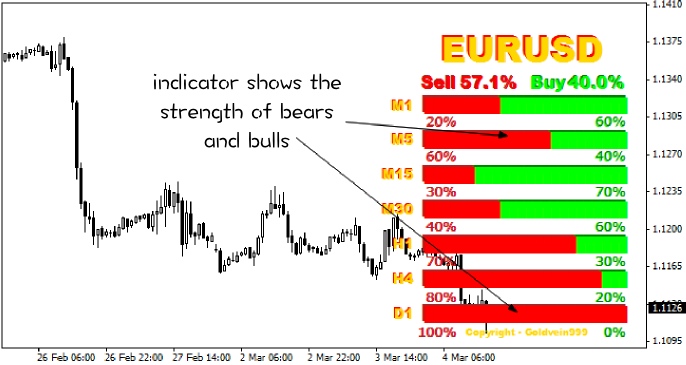
For example, if 4 technical indicators are analyzed, three of which are giving a signal to buy (according to the classical interpretation) and one recommends selling – the trader decides to buy. The question arises: why use third-party resources, if you can set specific indicators? One of these algorithms is called Trade Assistant (TA) and is presented on the screen as follows:
In fact, TA analyzes the following indicators for beginners: one Stochastic, two RSI with different periods and CCI, after which it informs the trader about the trends on all major timeframes (M5, M15, M30, H1, H4, D1) in a separate window. Thus, the trader is able to assess the technical picture on the entire market in just a few seconds.
An expert called Strength solves a similar problem by calculating the trend strength for each timeframe using several moving averages and RSI. At that, while the user had to customize the parameters of the basic indicators in TA, in this case the developers have already chosen the optimal settings.
In fairness, we should note that these indicators will be useful not only for novice speculators, but also for experienced traders trading on strategies similar to "Three Screens" by Alexander Elder. If you give up the opportunity to save time as a matter of principle, you can go back from a successful trader to the camp of beginners very quickly, because developing the indicator system is half the battle, as the search for alternative income-generating opportunities for other instruments is no less important.
Information indicators for beginners
It is no secret that many traders start out with trading on the news. Paradoxically, but this is the most controversial and complex procedure that requires a good knowledge of macroeconomics and fast response. However, while the knowledge comes from experience, the speed of reaction to the news is always a problem, because while a "private" trader gets information from the economic calendar or finds it in the news section of the terminal, the impulsive movement may already be running out.
Special news indicators for beginners help solve this problem. They are usually singled out for one simple reason – they do not require special libraries and other files, i.e. it is enough to download the .ex4 file and place it in the root folder with indicators to get started. One such assistant is FxPulse 3.0 indicator:
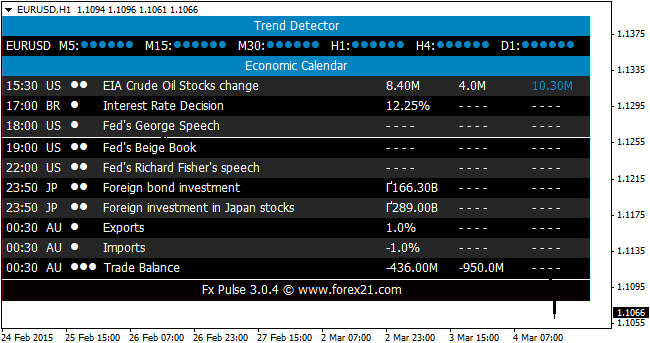
You can set only two parameters in FxPulse setting – the location of the information table and the terminal time shift from GMT – the news appear only from the list created by developers. Such an approach may seem primitive to professionals, but for a beginner who can’t independently select the really important events yet, it is the best option.
To allow the indicator to work correctly, you should also mark the point “allow DLL import”. We should also mention another advantage of this "calendar" – unlike many analogues, it does not load the terminal, i.e. MetaTrader4 does not freeze at the time of data update with the notification "Application not responding".
To summarize, we should note that the indicators for beginners are a kind of exercise, so it's best to work with them on training and cent accounts, not in the real market. In addition, regular sounds and alerts will allow to decide whether you can sustain such a rhythm of work or not, because the most common problem that significantly reduces expectation of the transaction is missing signals.
In any case, after a while, a trader understands which timeframe is the most convenient to work, decides on the currency pair, notes some of the features of the market, and so on, so the strategy begins to take more precise shapes and characteristics, and thus more accurate and specialized indicators get involved in work.
Social button for Joomla


