

")
EMA is one of the most common indicators used in application of technical analysis. Despite being a lagging indicator, its application does well in trend directions.
So, let’s take a closer look at this indicator. Actually, it is a simple moving average – that is, a sum of the periods’ values divided by the amount. But since it is EMA, it means that the average is exponential. And this, in its turn, means that the exponential moving average registers not only the new values but also the old ones, thus reflecting the price movement more efficiently.
How to apply EMA indicator in practice? First of all, you must consider the ability of the indicator to reflect the behavior of price performance in the market. To do this, the appropriate parameters must be set. The first one is the value that will lead indicator calculation, while the second will be the line shift for a certain number of time periods. One of the advantages of this analytical tool is that it is very easy to adjust and analyze manually.
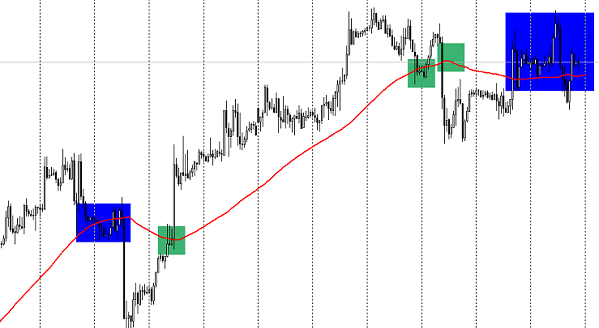
The easiest and the most reliable signal of the indicator is EMA price line crossing the chart. If the price breaks the line upwards, it is a signal to buy, and if it breaks it downwards, it is a signal to sell. Such signals are shown as a green square in the above image.
Another purpose of the indicator is to determine support and resistance levels. However, it should be noted that the larger the value of EMA, the greater and more accurate the levels will be. It is shown as a blue square in the image. However, the simplicity and reliability of this analytical tool doesn’t end here. Let’s just add another EMA, a more sensitive one – that is, with a smaller parameter.
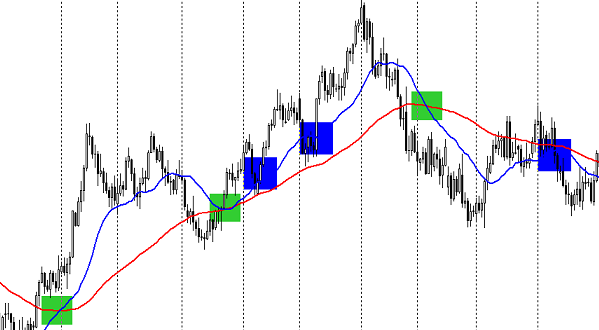
So, as shown in the image, the application of two EMA lines provides a more complete picture. If you look at details, you will find two additional signals. The first one is when a more sensitive EMA (blue one) crosses the average with a smaller parameter, i.e. a smoother one. This forms a signal: if it’s upwards, then it’s to buy. If it’s downwards, then it’s to sell. They are marked as a green square in the image.
And the second signal is when at a certain movement the price breaks fast EMA in the direction of the slow EMA. Downwards means to sell, upwards is to buy. It is marked as a blue square in the image.
In such a way, EMA indicator can provide a whole range of signals and levels that need to be analyzed and used in trading. Moreover, the diversity of this simple tool allows to improvise in large quantities, which can allow creating entire trading systems.
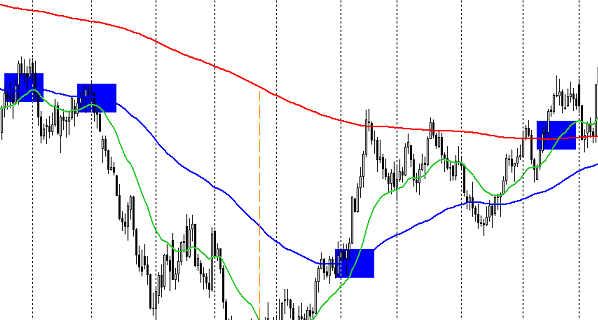
Above there is a graphical example of how to use EMA indicator in three ways at once. This is a trading system based on three EMAs. Their parameters are as follows: EMA-360, EMA-89, EMA-21. The most long-term average line allows to identify the main long-term movement, which may last up to a year or more, clearly signaling about the levels and trend changes. It also allows to define the “bottom” of the price movement, which is a sin not to take advantage of. Medium- and short-term EMAs allow analyzing faster and determine the time of an open order. Therefore, EMA indicator consisting of three lines enables a trader to see the most important factors of price movement. They are a long-term trend, signals for the opening and closing orders, and levels that define the likelihood of further movement.
In brief, this indicator with a very simple principle, if used proficiently, may become a very powerful tool for online trading.
Social button for Joomla