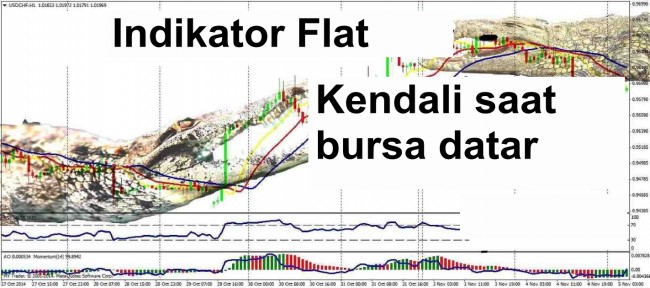
According to statistics, the price spends 70% of the market time in flat mode, while trading during the trend brings 70% of earnings. Various choices of flat indicators are designed for the correct identification of the weakly volatile areas of the market and help traders successfully enter the market at the beginning of a trend.
Flat or range as a period of weak price movement can be observed on any trading instrument. Visually, it looks just like a weak volatility, but in fundamental terms, flat means that there is almost no liquidity at the market. If you carry out the analysis in conjunction with the volume indicators, even the so-called wide flat (60-100 points) works by speculative sharp surges in both directions, because the price movement is not supported with the real trading volume. Flat periods are relevant before or after the sudden news movements that knock out the gamers’ stops, or a protracted trend, in result of which the interests of sellers/buyers are fully worked out.
Trading during flat is difficult and dangerous, especially for the fans of aggressive trading. Flat indicators, when properly used, can allow you to see the moment of exit from hibernation and prepare in advance for either an active entry to a market, or the entry by the trend after the subsequent analysis.
Mathematics, installation and customization of indicators
A variety of methods for determining a flat market include multivariate analysis of the current price dynamics. Regardless of the type and complexity of the indicator, the calculation algorithm should include the following stages:
- Comprehensive analysis of trading volumes;
- Calculation of the relative and absolute deviations from the average value;
- Calculation of market strength (analysis of the current supply/demand);
- Calculation of the future movement (by price and time);
- Construction of visual graphical elements depending on the type of indicator.
Important: internal algorithms for calculating the indicators can work with the same logic and accuracy on any timeframe.
Flat indicators are installed and configured according to standard procedure, we will not go in details here. The number of settings ranges from 1-2 to a few dozens. It is important to understand that the qualitative analysis of a flat market is directly dependent on the accuracy of the calculation. What looks like a flat on the large/medium periods can have trendy sections on small ones that are quite suitable for trading, so a large number of settings look quite reasonable.
Important: flat on any timeframe can be only a particular case of market movement. It is possible that at the same time there is a steady trend on a smaller or larger period.
The range size depends on the average volatility of a particular trading instrument. Indicators necessarily calculate and analyze the average data for the period, because for active pairs, like GBP and its crosses, the movement by 50-70 points in both directions can be considered as intraday flat, while 70 points up or down for a slow-moving NZD is a full daily trend.
The main types of flat indicators
The indicators are classified by standard groups:
- Trend (graphics, signal, information);
- Oscillators (single or complex);
- Volume indicators.
Trend flat indicators seem the most logical. They may have various types, parameters, graphic elements and colors, but their main task is to build a price channel with the boundaries, direction and levels of volatility.
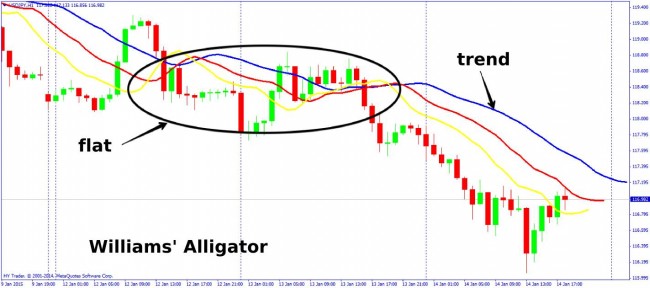
The easiest example of the trend flat indicator is a set of moving averages: if the lines are mutually divergent, there is a market trend, if they run parallel (or intertwined) – the market is flat. A classic example is Williams’ Alligator. While baselines are intertwined, the market is flat. If the Alligator "opens mouth", formation of a new trend begins.
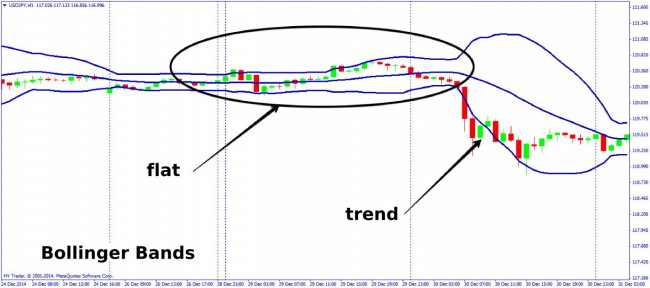
Conventional Bollinger Bands at the horizontal direction of the indicator reliably identify flat, with a wide range allowing some very brave to trade on a rebound from the boundaries, and the narrow channel means a strong future trend.
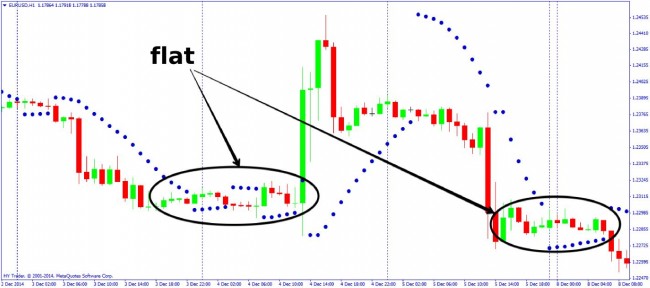
The trend signal flat indicator can also be variants of Parabolic SAR – the closer and smoother the signal points, the more reliable the condition of a flat market.
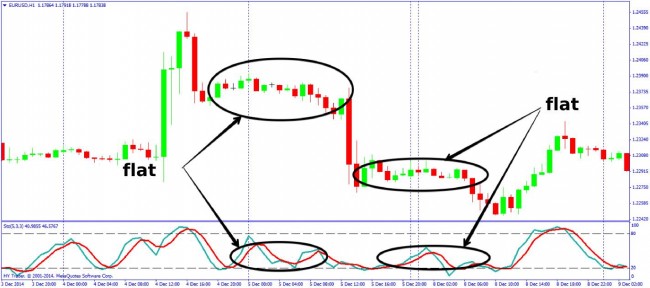
It is believed that the oscillator-type indicators show the most reliable flat – in the form of movement of the signal lines in the middle of the working area of the indicator between the overbought/oversold levels. The closer the line to the zero level, the narrower and more enduring the flat will be. Most of these indicators are various modifications of Stochastic Oscillator or Williams%R – one or two signal lines in a range from 0 to 100 work (sometimes from -100 to +100).
Important: the oscillators only show a general tendency: trend or flat, but do not say in which direction the breakthrough is expected. The drawback of the indicators is delay during the exit from the flat.
Sometimes indicators change colors depending on the results of market analysis for the presence of a flat market – for example, the Pulse Flat indicator.
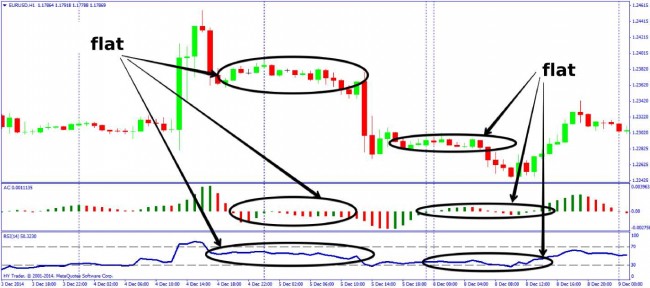
After a careful optimization, Accelerator Oscillator (AC) is a good indicator of a flat market – at weak volatility, the working histogram bars become small and fluctuate around the baseline.
We shall also note the Relative Strength Index, which shows the ratio of the average rising closing prices to the average falling closing prices. If the trading signal of RSI is divergence, the period of a flat market is its absence.
Another option is the Trend Filter oscillator, which shows only the presence of a trend/flat without redraw.
In practice, one of the best indicators of a flat market is ADX. Its sophisticated calculation algorithm allows in most cases to remove the delay and predict further movement.
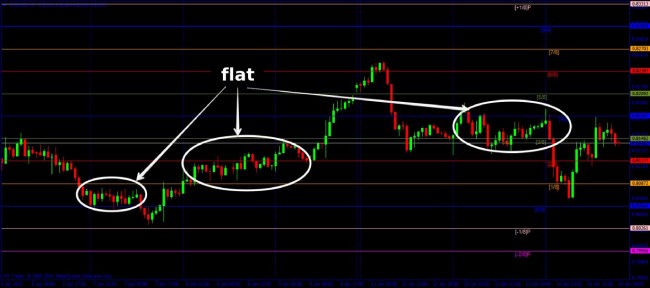
You can even use Murray levels, considering that most of the time the price spends in the range from 5/8 "channel up" and 3/8 "channel bottom".
Another indicator of the sideways movement is Envelopes – it visually builds the channel, the horizontal direction of which shows flat.
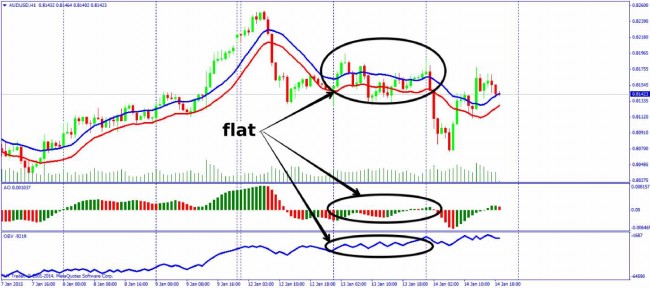
As an example of volume flat indicators we can mention the standard On Balance Volume, Volumes, as well as a comprehensive indicator of the volume + oscillator Awesome Oscillator. Flat is usually characterized by low trading volumes, but these indicators help to separate the real range from the active trades that do not lead to strong price movements, but are characterized by large opposite volumes (then it is not flat, but rather the period of an active struggle).
Use in trading
The task of flat indicators is to show horizontal low volatile periods. The boundaries of any flat cope well with the functions of support/resistance lines, rebound from them sometimes makes it possible to trade in the channel, confident breakthrough – to enter the market at the beginning of a trend.
Important: Please note that the breakthrough of the range boundaries is possible at any time and it’s difficult to accurately assess the future direction of the movement. If you "wait out" the flat with open positions, be sure to take measures to insure the possible loss.
Range is the market period of rest, analysis and energy refill. The width and length of the sections reflect the degree of uncertainty of investors who study the current market and choose a direction to open positions. During the flat market, most pending orders outside the channel are placed. The impetus for a breakthrough can be both technical factors (overweight of the orders in the direction of the sellers or buyers, major players entering the market) and fundamental (news, political events or other force majeure). The longer the section and the narrower the range, the stronger the "shot" after exit from the flat will be and the longer the new trend.
The correct exit from the flat market is a guarantee of profit. The trading technique is common: after receiving a signal from a flat indicator about a possible exit from the channel, the scalper can place a bunch of pending orders outside the boundaries in order to catch the surge at the exit, and the medium-term trader can get ready to work by a new trend.
And as a conclusion...
The flat sections must be defined precisely in order to refrain from trading. This will help keep your deposit and nerves. The main problem of the novice or super-active traders is the lack of patience to wait out the dangerous sideways movement and be prepared to work by the trend. Even if you can sometimes earn from the rebound from the channel boundaries, in no case you should build a trading system on this rare luck. With judicious use, the complex flat indicators are a necessary element of any profitable trading strategy.


