Tick indicators in online trading are quite a specific type of technical analysis tools. While any other tool displays the interpretation of prices or a market situation using direct levels or price values, tick indicators work exclusively in the calculating direction. They are the indicators that display the number of price fluctuations ticks. That is, if the deals are made in the course of trading, the price is decreasing or increasing with the flow of the money stock regulating the supply and demand. This, in its turn, is displayed as ticks on the chart. So if you open a tick chart in the terminal and move closer to the right of the price chart, you will notice that the price fluctuations by the points and ticks are the same. Hence we can make a conclusion that the number of deals made carries a certain amount of money to the market, which in turn affects the price. This is how oscillation by points occurs within a certain time. This amount of oscillation is expressed in a prime and is shown on a simple scale called tick indicator.
An example of such a simple mechanism is a simple tool called Ticks Volume Indicator. This indicator reflects the index of the number of ticks (price movements), also known as volume. But it should be noted that none of the tick indicators reflects the number of contracts or the money stock that pushes the price up or down. This technical tool will only show the movement “frequency” or liveliness of the price.

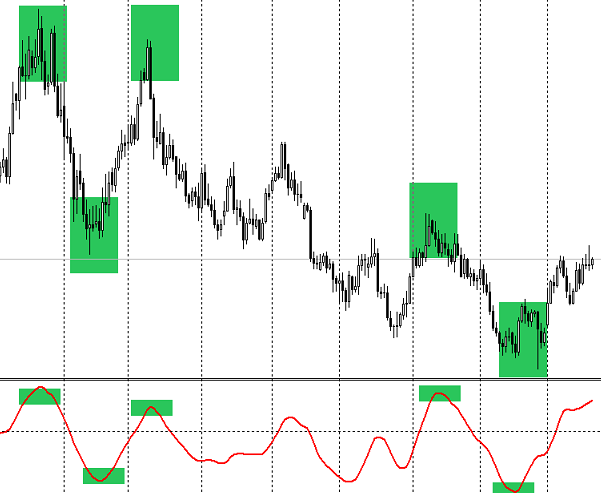
If you look at the graph shown above, you can notice how the number of ticks increases with significant movements. If the price rises and the indicator shows an increase in the number of ticks, while moving up from zero mark, it indicates that the movement is in force and it is likely to continue. The same rule is true with the price moving down, with the only difference that the indicator value should be negative. Any tick indicator works quite specifically, but its use in standard directions also makes sense.

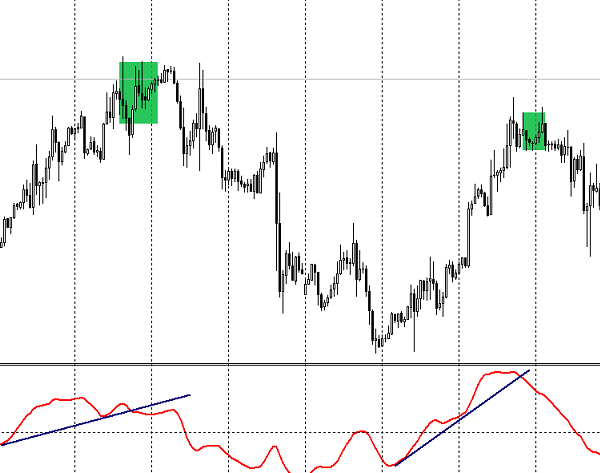
The majority of oscillators work as illustrated in the chart above. TVI indicator is no exception. Thus, using the values of support and resistance lines on the indicator itself, you can open orders at the breakdown. Such additional use increases the efficiency of TVI indicator.
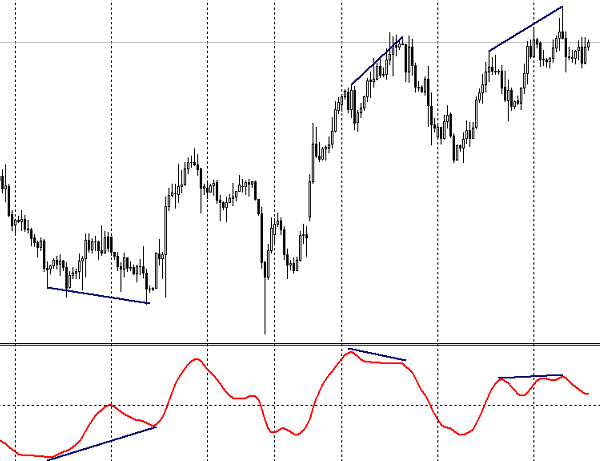
The best known and effective method of signal to open orders should not be avoided either: it is a method of convergence-divergence.

All other things being equal, an important argument should not be missed. The frequency and the number of ticks are increasing if the time interval decreases, because they are more sensitive to the amount of deals. This occurs due to the fact that the price interval decreases and it becomes possible to reflect more accurate and deeper price fluctuations. At the same time, such a detailed reflection carries a lot of extra information, which looks like the market noise. Therefore, more accurate analysts require not to use this tick indicator on its own and at small time intervals. However, there are many traders who fit these indicators to trade on the minute charts.
TVI ticks indicator is better to use when trading at long time intervals. The argument is rather serious: the price range for long time intervals doesn’t allow to display the greater number of ticks than smaller time intervals do. Therefore, the money stock used in the deals should be significant to make one tick. This, in its turn, shows that there are heavy buyers or sellers at the market. Consequently, the price movement will be quite substantial and cleaner.
Social button for Joomla


