

")
There has long been a lot of debate about the efficiency and fractals signals interpretation in online trading. However, the fact that the Fractal indicator is used in stock trading is undeniable. Moreover, it is used with other indicators. So, what does this magic indicator look like, why don’t many people understand it and why is it so controversial?
This analytical tool was invented and applied by Bill Williams – a legend, a multimillionaire, and a professional trader. Many people now dispute the fact that the Fractal indicator has something to do with the fractal geometry. But it’s the truth, and we can explain it with an analogy: the principle of fractal geometry is that irregularities or curves, noncharacteristic to straight lines and angles, have a structure of regular geometric shapes. That is, the irregular form a kind of consists of certain regular forms. And we can define an entire area or a plane in this way, decreasing in size, to infinity.
Fractals in trading are similar. A price chart is divided into separate components in the form of the local segments. These chart segments consist of at least five candles. And this indicator defines the highs and lows of these small sets of candles.
 Thus, the entire price chart consists of such “pieces”, each of which has a high and a low. Trading process is applicable in its simplicity. In addition, an example of fractals application in online trading is the brightest and, we would say, the only example of implementation of pure mathematics.
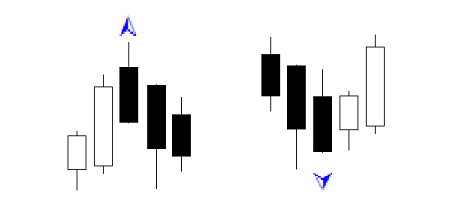
Thus, we are done with the structure and the principle. Now let’s proceed directly to analytics. The image below shows the principle familiar to everyone. A high and a low are formed from the combination of fractals. In our case, the price rises, and we immediately open an order to buy. The stop is set at the level of the first lower fractal, and a profit is at your will.
The following image is the same, but with opening an order to sell.
In such a way, a permanent and regular breakout of prices’ extremes takes place with high frequency. It should be noted that at longer time intervals the optimization of the indicator is much higher, but there is, of course, a better use of this tool. The Fractal indicator is used with the trend indicator Alligator. It tracks the trend movement, while filtering the fractals’ operation.
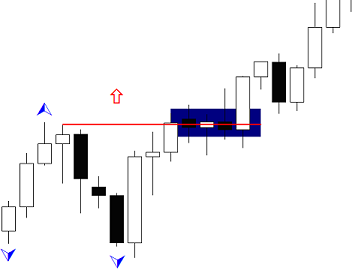
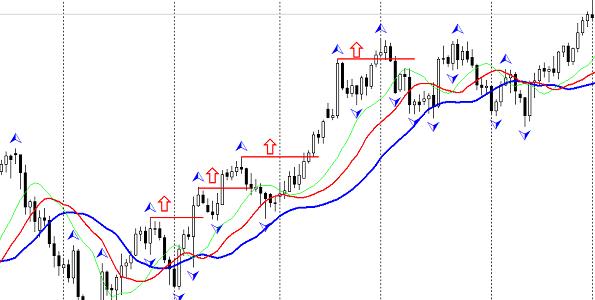
The following image shows a system based on fractals and the Alligator. The principle is as follows: you should buy only when the guiding fractal is above the Alligator indicator. And vice versa – you should sell only when the guiding fractal is below the Alligator lines. Another nuance should be noted: as shown in the picture, the Fractal indicator gives a signal after the substantial price passage, thus reducing profits. But since the order is opened in the main trend, the fractal extremes are usually broken through, because the Alligator doesn’t “tell” about the trend change.
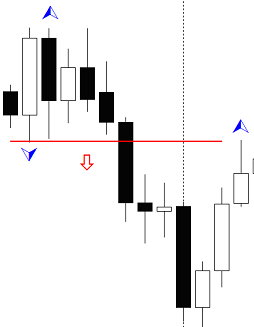
However, there is another use of fractals and the Alligator.
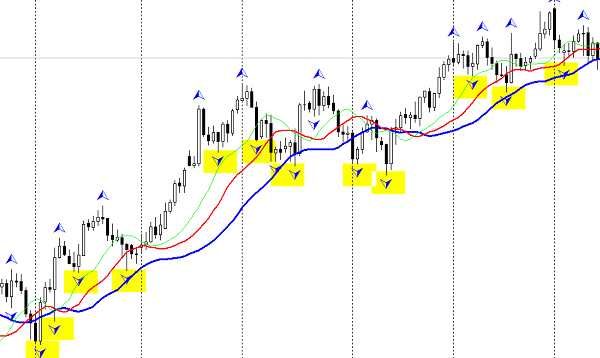
In this case, the signal comes in the different way: after the lower fractal is worked out, the Alligator lines should cross. Once they crossed, the order is opened. If there was a change in the trend movement, you should expect the fractal on the other side, to open an order in the opposite direction after the crossing.
Thus, an analysis and trading are performed with this data analysis tools. Of course, the improvisation in applying fractals is very wide. But the most important thing is that the Fractal indicator works on the principle of locality, which in turn forms a price movement on the chart.