

")
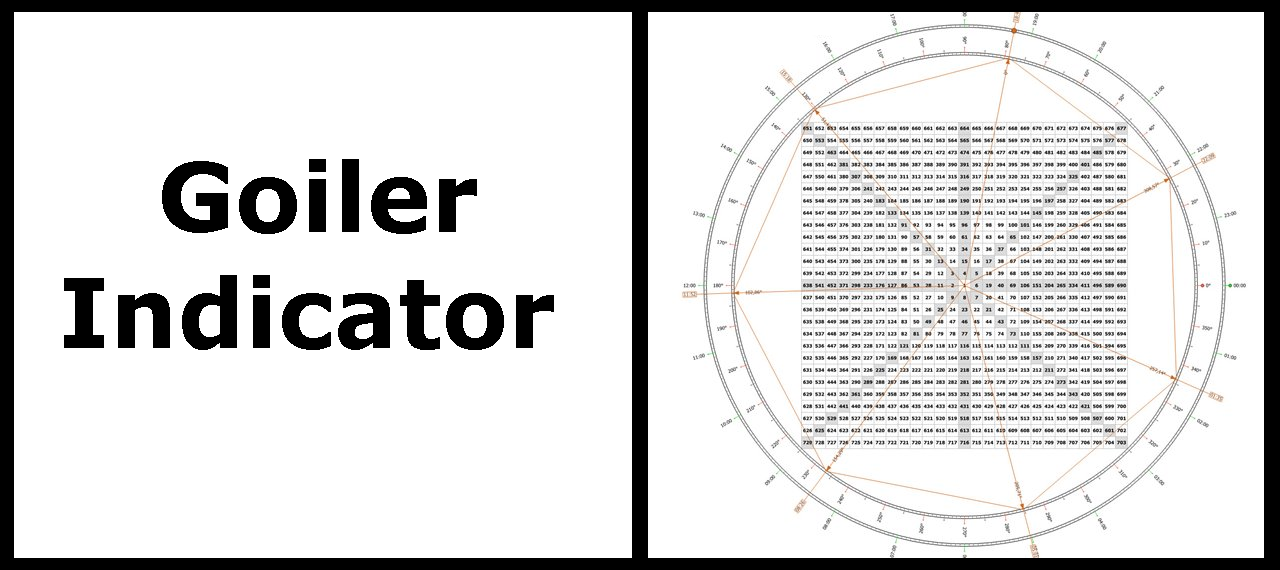
Recently, leveling indicators became widespread, from various lines modifications and Fibonacci numbers to options and volume levels. The Goiler indicator falls into this “genus”, and uses methods of William Gann in its work.
In the meantime, traders continue to argue (even right now) on one simple question: whether the indicators are worth to be used in trading or not. Generally, all the criticism of this analysis method is non-constructive and results from misunderstanding of the fact that the signals of any strategy must be supported by statistical observations. The Goiler indicator is no exception, as it can give false signals at the moment, but is a good addition to any strategy at a distance.
Using Goiler indicator as an independent signal generator
On the first stage, the algorithm examines the history, and at the moment of a new daily candle opening (at 00:00 terminal time) applies only five lines on the chart. The figure below shows the markup for GBP/USD pair on 03 Apr 2014:
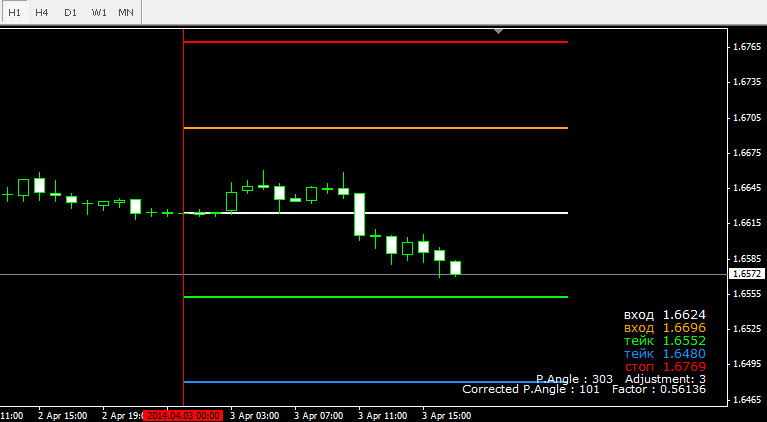
A white line (in the center, we’ll call it “zero”) is marked by the opening price of the day, after which just one signal is formed for the current day. If the green level is below zero, it is a signal to sell, otherwise – a signal to buy. Let’s review what each line means in more detail.
The most important one is green, which is the first target to set a take-profit or a price benchmark to convert the deal to a breakeven – the choice of position management option depends on the strategy. The second and final profit target is a blue line. According to our observations, the price rarely reaches such marks, so therefore it is better to split a deal into two parts: a half is fixed by the green line, and the remaining volume is either kept until working out the second target, or is manually closed at the end of the day.
A red line marks the level to place a stop-loss. The most controversial of them all is an orange one, which indicates the price for topping-up towards the original direction, if the price rolles back against the main position after the day opening. The very contradiction lies in the feasibility of averaging against the trend, but this is a topic for another article, while in our case, the take-profit on the total position is moved to a zero line after the topping-up.
Goiler indicator and its inherent strengths and weaknesses
As we noted above, any indicator requires a representative sampling of the signals, but the author's version of the Goiler deletes the old layout every day, and this makes it difficult to analyze the history. This problem can be solved by creating an EA or using an algorithm modification in the work, which just makes “cosmetic” changes, one example of which is shown below:
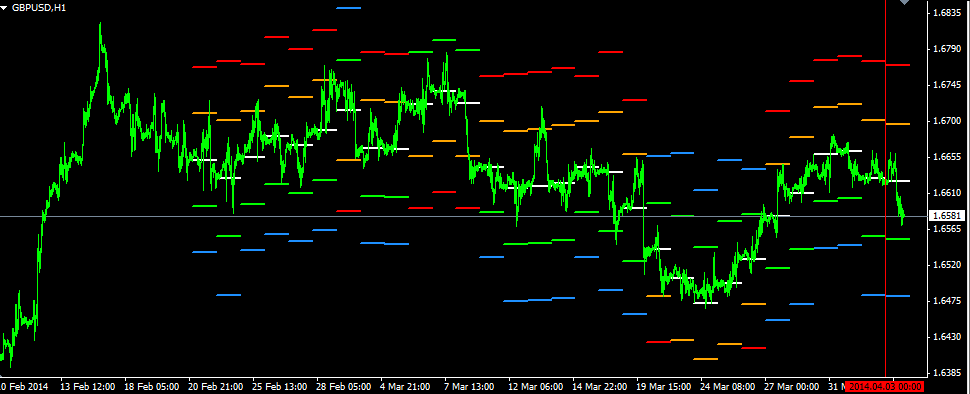
Although the signal aggregate analysis by means of excel is beyond the scope of this article, even a naked eye can see that the signals are in general processed well, but, on the classics of the genre, in periods of the trend reversal there are series of losses. Thus, in order to reduce the negative effects of this drawback, it is reasonable to use additional filters for the entry point in the original direction, i.e. the Goiler becomes a simple trend indicator.
To summarize, the following strengths of the given algorithm can be emphasized:
-
The levels built in the first minute of the day can’t be redrawn during the day;
-
Exactly one signal is guaranteed – some may consider this a disadvantage, but in our opinion, it is sufficient for such systems, because the more levels means the lower the quality of forecasting;
-
Easy to set up, the indicator makes all the calculations on its own.
The Goiler indicator also has a number of obvious drawbacks:
-
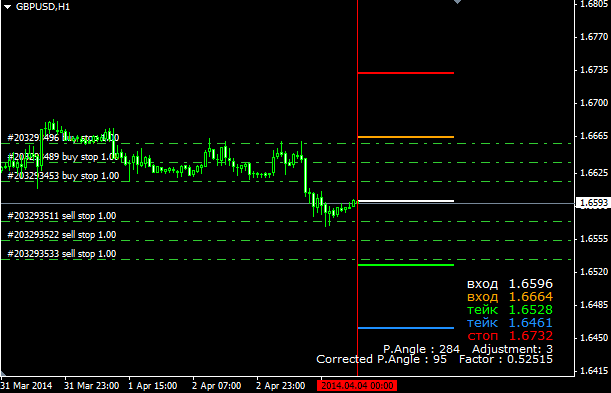
The targets are often marked in the obviously unattainable distance, which is a consequence of the specificity of the Gann method. To solve this problem, we recommend manually marking the additional levels between the standard ones. Theoretically, you could even create a grid by placing stop-type orders. An example of such work is presented below:
-
Big stop-losses, as when you open the deal, a stop is equal to take-profit, which in the context of rare signals creates additional risks.