

")
Many indicators with designated purpose of making the technical analysis perfect can be divided into so-called subspecies. In other words, we can single out groups of derivatives for technical analysis. First of all, they are indicators that have undergone some changes in calculations aimed at more efficient analysis. Among them, we can highlight the ones with simple changes (color, sound or extra calculation is added) and indicators that are formed by the merge of two other indicators. Sometimes it turns into a whole trading strategy. Here we can single out a Goodtrade indicator. Its main purpose is delineation of waves in the areas of Fibonacci levels. Such combined use forms a trading system for online operations.
The notable fact is that this indicator is based on two basic principles. They are Elliot Wave theory, where waves are reflected in the horizontal levels, producing moments that define orders opening at the bullish or bearish trend. We believe that this trading system is worth being resolved into simple components that are available for most traders.
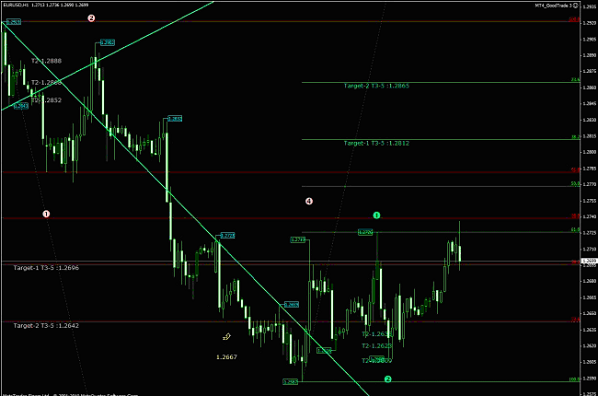
The principle is the same. Goodtrade indicator defines the structure of the trend movement resulting from the small waves. Thus, this indicator, or rather half of it, works out the major and minor waves. I think, problematics should immediately be pointed out: it is overdraw. This is a big drawback of many indicators that require additions to eliminate it. ZigZag and similar indicators work in a similar way, as well as various semaphore technical tools. But in our case, the Goodtrade indicator suggests a significant and quite strong addition: Fibonacci levels, which provide an opportunity to complement the seriousness of a particular wave formation. In other words, drawing of a meaningful wave within a level gives a signal to open the order. The most important task is to determine the main trend movement.
It would seem quite simple: there is a wave and its importance is determined by Fibonacci level, or vice versa – the level confirmed by the wave clarifies the definition of main movement, and as a result, allows opening orders in the direction of the main movement. But here lies the catch.
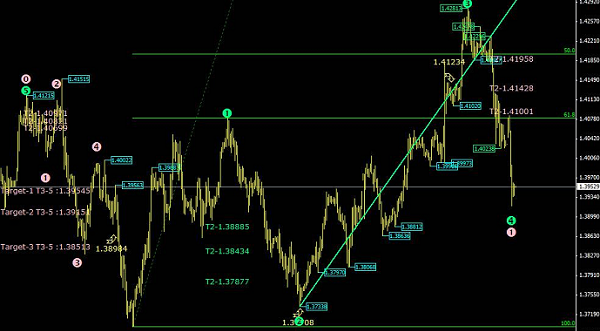
And it is as follows: Fibonacci levels already have approved values – not only by the traders, but also by strong mathematical and historical factors. In short words, they are permanent. But you can change parameters of the wave part of the indicator! This suggests that it is not necessarily to use Fibonacci levels with this indicator. After all, if we set the value of ZigZag indicator as, say, 61, then the next wave will be drawn after passing 61% of the preceding wave length.
In other words, the wave will be drawn representing the level of the same values that Fibonacci levels provide. The first question here is what about 50%? Or 23%? It's easy. You can apply two more of the same indicator on the chart with parameters set as in Fibonacci levels. That's it. A striking example is ZigZag indicator applied on the chart three times and having the values of 61, 50, 23.
Of course, fantasy and fictions of traders shouldn’t be criticized, the rather that we all try to find that mythical key that can lead us to greater returns. And the fact that this Goodtrade indicator was once created shows that attempts to overcome the markets will never stop. And who knows who will come up with a real "”Holy Grail”?