

")

In the community of novice speculators, there’s one myth taking roots about the existence of a certain miraculous algorithm that can solve any problem and search for lossless trading signals. It's called Grail indicator, and we’ll review it today.
To release the readers from illusions, let's start with a historical reference. In general, what is Grail? According to biblical tradition, it is a cup from which Jesus drank at the "Last Supper". Of course, the issue of searches for this relic acquired a special meaning across the history, but the important thing is that nobody actually ever saw it.
To date, no documentary evidence has been found, which would describe not the healing properties of the subject, but at least its appearance and metal the bowl is made from. Therefore, the term "Grail indicator" is a rather humorous name and means the pursuit of an abstract dream to learn how to trade without any losses by means of the indicator analysis.
Does the Grail indicator exist? Opinion of the search engines
If you type the corresponding request into the search fiend, Google will prompt you to visit a few forums where this indicator is allegedly discussed. In fact, all these topics are devoted to entirely different indicators.
There are causes of this phenomenon: first, some authors (in most cases, the newcomers) have created the topics with such names under the impression; and second, some developers try to draw attention to their paid products in such a way.
The latter option we will not comment, but review one example from the first group. This Grail indicator is called “FullSSA_normalize”, though it in fact originally consisted of three indicators: SSA, RSX and FullSSA_normalize.
Why "consisted"? Because by 2015, only RSX remained operation from this set, the other algorithms in the new terminal assemblies are compiled with no critical errors, but don’t process the price on the chart (the library required for operation is missing in the versions on forums). If anyone is interested to see what kind of markup this algorithm built, here is one of the screenshots of the working window:
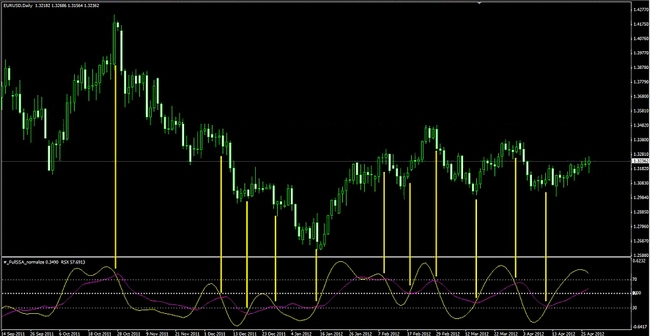
Grail indicator generated signals at the intersection of SSA and RSX lines, while considering only signals that appear between the overbought and oversold boundaries. Thus, the trader had to either open a long position on a currency pair if the yellow line crossed the purple at the top of the range of oscillators, or work from the short at the reverse combination of the signals.
It can be seen on the figure that almost all the signals brought a handsome profit, so the conspiracy theorists can already begin to build a theory on the subject of why this strategy has stopped working, but in reality it's much easier – markup on the history repainted. Hence the imaginary "grail", which is also true about all of such algorithms with great names.
Indicator Grail and its "splinter"
Since we mentioned the "legendary" topic today, like the archaeologists, we will conduct a study of the fragment of the old algorithm – maybe it will be useful? Thus, the indicator RSX is a classical oscillator and is represented on the chart as a purple line. A trader can only specify the period of calculation in the settings, although the formulas of the expert are not secret and are available to the general public.
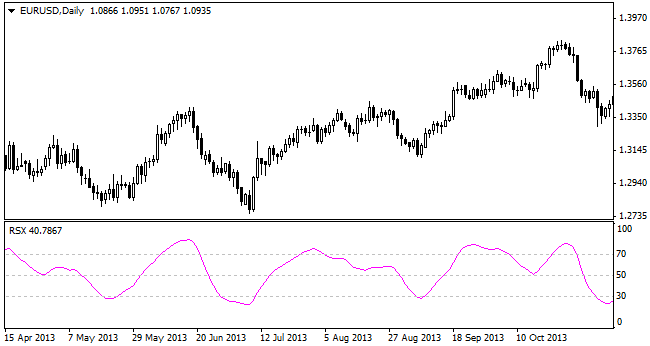
By the way, while the indicator Grail in its last combination was a relatively fresh solution (created in 2012) and in a few years proved to be ineffective, the RSX works steadily since 2007. Given this fact alone, you should pay close attention to this algorithm that can be used in three main directions.
The first method is similar to the original strategy, but the ordinary moving average will be used instead of SSA. To set up the working window, we’ll first set the oscillator on the chart, and then select SMA in the navigator (with a period of 5 candles) and using a command "Apply to: Previous Indicator's Data", set it to the basement window. As a result, we get the following picture:
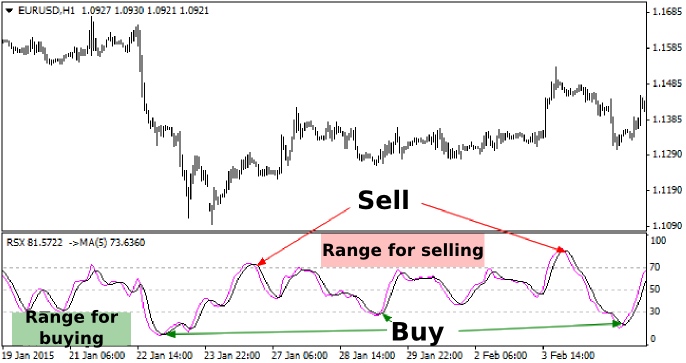
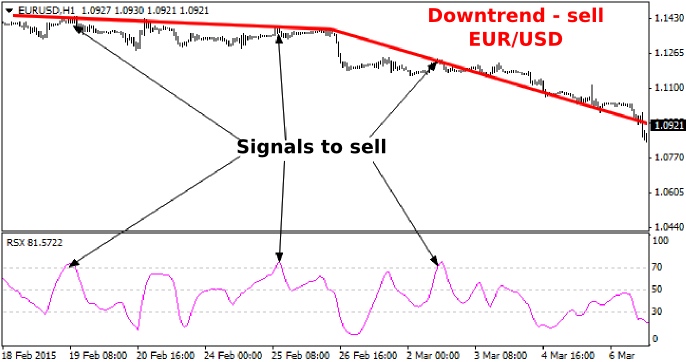
We buy an instrument in the case when the main line has crossed the moving in range from 0 to 30, and sell a pair only after the main line crossed the moving average in the range from 100 to 70. As can be seen, there is a large number of false signals in such kind of operation, so we recommend to trade only in the direction of the prevailing trend, which can be identified by any means available.
The second strategy involves the usual trading from indicator borders of overbought/oversold areas. In this case, the principle of operation is no different from working on RSI or stochastic oscillator, so we won’t focus on it, just note that the Grail indicator, or rather its constituent part RSX, generates signals with higher accuracy.
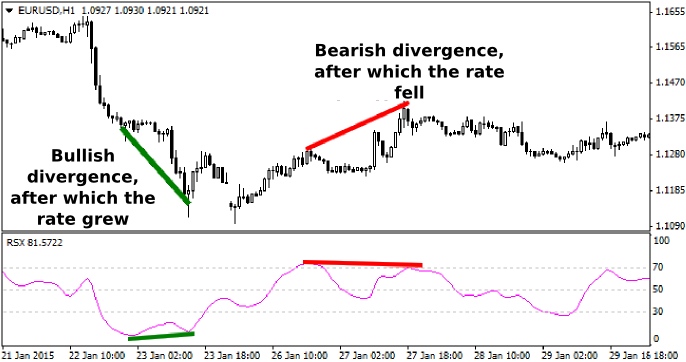
And many probably guessed about the latter method: it will be about divergences, which should be sought and interpreted by the classic means. To learn more about divergences, we recommend that you read relevant publications from our portal sections "Forex indicators" and "Trading Strategies". The following figure shows one example of bullish and bearish divergence:
Why does the Grail remain a myth?
Well, what can we say? Everything is like in reality – there is a legend about the miraculous bowl, but nobody has ever seen it over the millenniums, the same happens to the indicator – there are rumors about the existence of lossless algorithms, but for some reason nobody has ever found them over the last 10-15 years.
One could argue that they do exist, but nobody would share such software, because it is not profitable. This seems logical, but the billionaires are public people a priori, they all report to the tax authorities, and therefore if one genius alone could earn a fortune on a foreign exchange market, this information would have been made public.
However, so far the market does not know such examples: indeed, there are successful traders – millionaires, but they trade conservatively and consider losses integral part of their trading strategy. On the technical side of the issue, there is a long list of nuances, but the main ones are:
- All trading indicators are divided into two classes: trend and flat. This division was invented not without a reason, it follows from the features of mathematical formulas, so the Grail indicator must combine the incongruous;
- The market is not an abstraction, it is created by people and trading robots of market makers, no trader can anticipate the motives of market players and software settings of robots, let alone the formula with fixed values, thus losing trades cannot be avoided;
- A significant breakthrough in the prediction was made by traders applying neural network, but even they are focused on the overall result of the totality of transactions and admit the possibility of loss in each individual order.