

")
Since candlestick charts were included in the active arsenal of traders, they were constantly searching for their efficient interpretation. Technical Heiken Ashi indicator, based on the optimal logic of candlesticks, visually averages and smoothes out the market fluctuations, simplifies the market analysis and shows the best time to enter the market. Flexible, intuitive indicator has been successfully used in a variety of profitable trading strategies.
The first ideas of the indicator were published back in 2004 by the financial journalist Dan Valcu in the “Technical Analysis of STOCKS&COMMODITIES” journal. In 2003, he accidentally discovered stock charts with a unique technique that reverses the traditional view on the price chart and facilitates the perception of market trends, the so-called HeikenAshi charts or modified candles. The first attempt to apply this method adapted for the price bars has been so successful that the program code of the indicator for use in the trading terminal was developed by the author before the print publication.
So, what is nan desu ka or Heiken Ashi?
Heiken Ashi method (from Jap. Heiken – “balance” (“middle”), Ashi – “foot” (“band”)) allowed to create a visual tool to assess the presence of direction and strength of the trend. This is especially important for Forex as the most volatile of all financial markets.
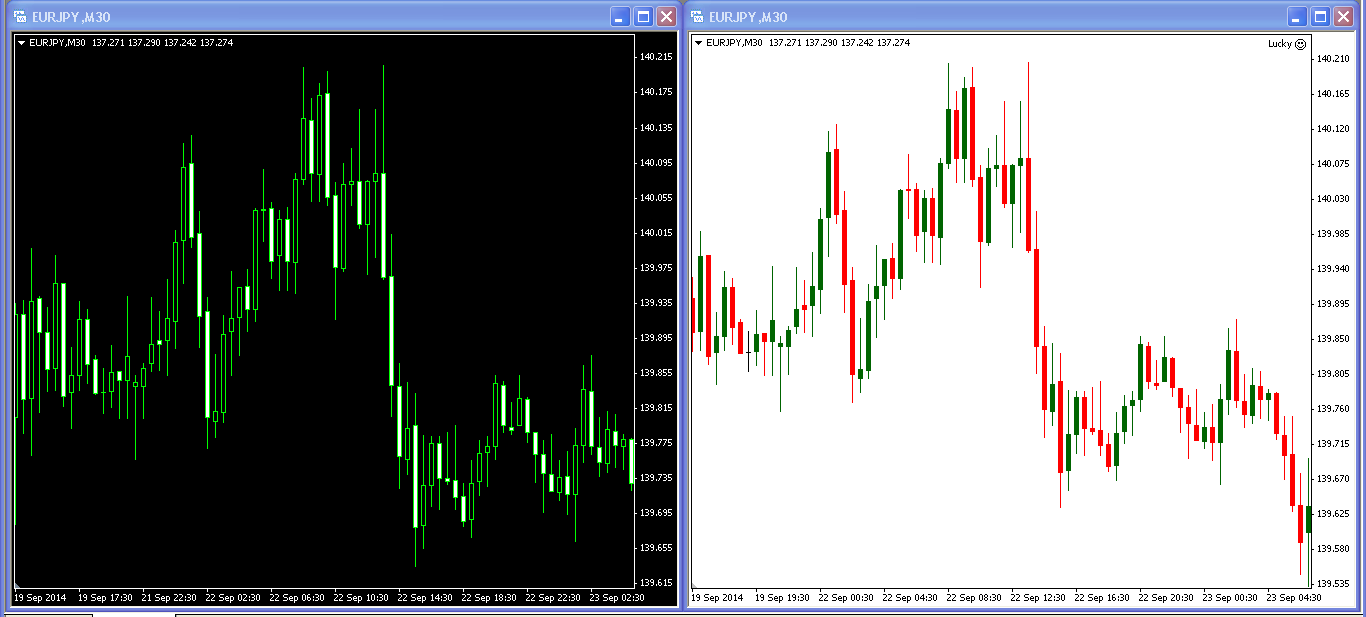
The main difference from the classical candles is that Heiken Ashi indicator draws common trading bars on the chart, but at the construction it processes the prices of each bar and averages, due to which the price chart is smoother. The candlesticks of a standard type are displayed with the body and shadow, depending on the movement of the market, of various colors: white or green (bulls), red (bears). The figure below shows a regular chart and the one using the indicator.
Parameters and math of the indicator
The following are the formulas for calculating the change of OHLC values of the candle of Heiken Ashi indicator.
Closing of the current bar:
haClose = (Open+High+Low+Close)/4;
Opening of the current bar:
haOpen=(haOpen[prev.]+haClose[prev.])/2;
High of the current bar:
haHigh=Max(High, haOpen, haClose);
Low of the current bar:
haLow=Min(Low, haOpen, haClose).
The price values of Open-High-Low-Close refer to the current bar (the one that is being built). Prefix [ha-] identifies the changed values (respectively) by the Heiken Ashi method.
These given formulas mean that the Heiken Ashi indicator builds the bars with some delay, and trading signals also come with a delay, as the prices to build the current Heiken Ashi candle depend on the price of the previous candle.
This delay is a major advantage, and the only drawback of the indicator. Thanks to the "built-in" lag, the indicator is indispensable when working with volatile pairs (e.g. yen: EUR/JPY, GBP/JPY), as an indicator warns against premature "false" entries and "false" level breakthroughs.
Installation and setup
Heiken Ashi price charts in the form of candles are integrated into all available systems of technical analysis. Standard Heiken Ashi indicator is included in the MT4(5) basic set of indicators and is located in the section “Custom Indicators\Heiken_Ashi.mq4” or “Custom Indicators\Examples\Heiken_Ashi.mq5”. It contains only the configuration of colors and graphic elements. Can be installed in the usual way:
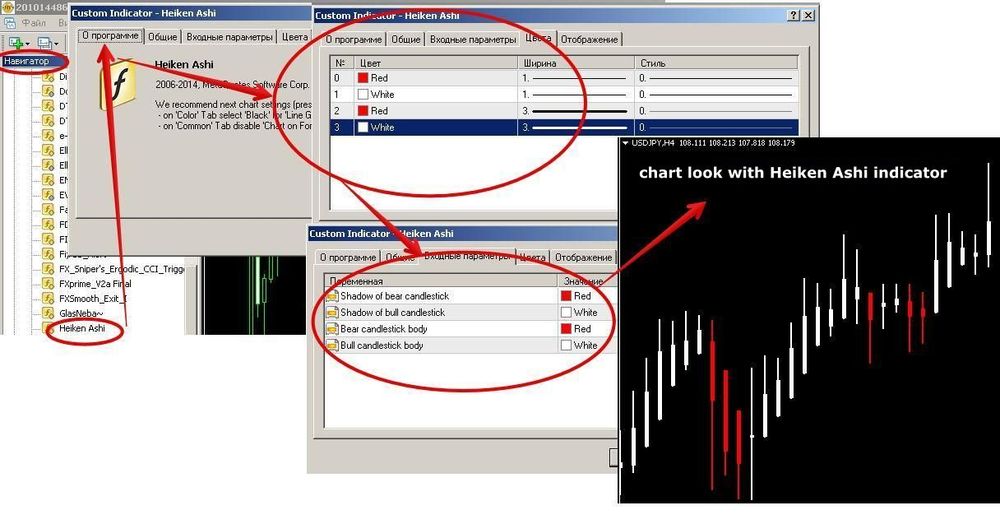
Different variations of the indicator may have more options.
Trading signals of Heiken Ashi indicator
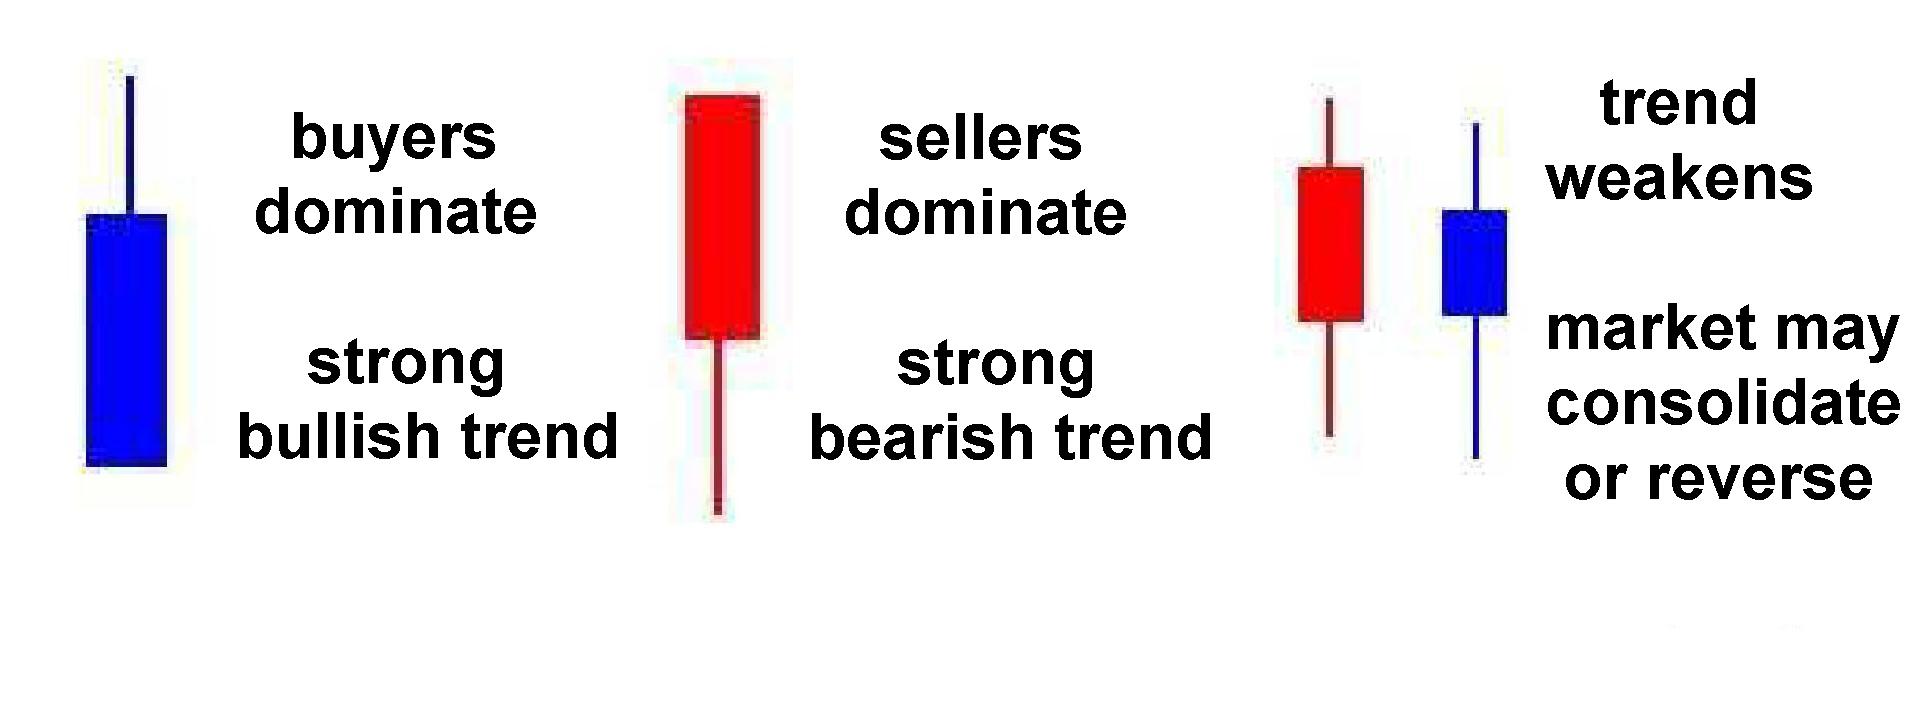
White (green, blue) candles or the row of candles:
-
large body without shadows: a strong increasing trend (to be continued). Trading signal: Buy or add to long positions.
-
with a large body and small shadows: the trend is rising. Trading signal: Buy or add to long positions.
-
with a small body and large shadows: the upward trend is weakening. Trading signal: Closing of long positions.
Red candles (or a row of candles)
-
large body with no shadows – a strong decreasing trend (to be continued). Trading signal: open deal to buy or add to short positions.
-
with a large body and small shadows: the trend is decreasing. Trading signal: open deal to buy or add to short positions.
-
with a small body and large shadows: the downward trend is weakening. Trading signal: Closing of short positions.
Candle (of any color) with a small body and large shadows:
Signal of "fatigue" of the trend and possible subsequent reversal (similar to Doji candle). Additional confirmation signal is needed. In some variants of this indicator, such candles are marked with a different color.
Use of indicator in trading systems
To create a trading algorithm, we can recommend the following rules to use Heiken Ashi, proposed by the author:
-
upward trend - white (blue, green) candle (haClose>haOpen).
-
downward trend - red candle (haClose<haOpen).
-
strong bullish trend - white (blue, green) candle without Low (haOpen=haLow).
-
strong bearish trend - red candle without High (haOpen=haHigh).
-
trend consolidation - row of candles (of any color) with a small body with long shadows.
-
trend reversal - candle (candles) with a small body of one color and the long shadows of the opposite color. However, such a signal is not entirely reliable, as it may be the 5th option (consolidation).
If there are conditions of 1-2-3-4 options (trend and strong trend), we open a position by setting a stop at 1-2 points above/below the min/max of the previous candle or holding open deals, consistently moving the stop on the market.
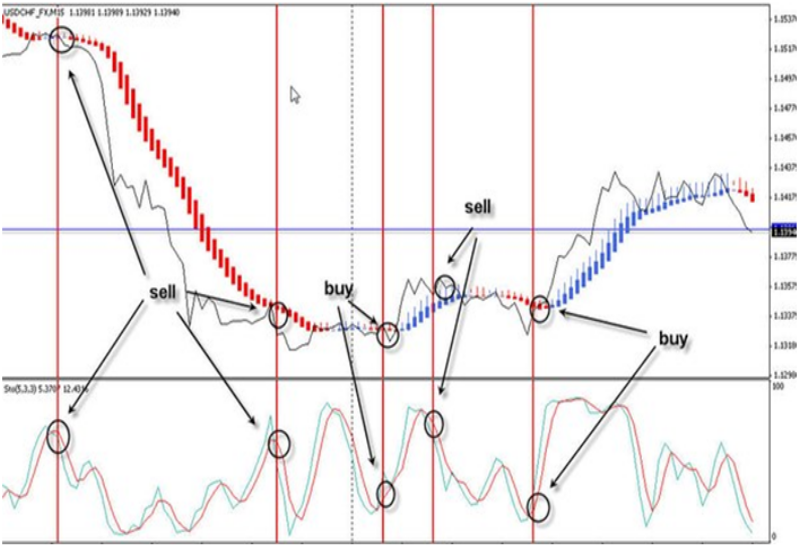
If the market sees the terms of option 5 (consolidation) or option 6 (trend reversal), the position is closed (no other options!), unless it does not close on its own, and we wait before the opening of new positions. There is a need for additional signals of filtering indicators (moving averages or oscillators). At the appearance of the candle of the opposite color at obtaining explicit confirmed signals, we close the current position and open a new one in the opposite direction. An example of the strategy using this indicator is shown below.
Advantages and disadvantages of Heiken Ashi indicator
Heiken Ashi technique changes the look of the candlestick chart, generating “synthetic” candles that take the price chart irregularity (noise) out of the common chart, offers the trader the improved picture, which clearly shows the areas of the trend and consolidation, as well as the strength of the market. In an uptrend, most white (blue, green) candles has no lower shadow and mast of red candles have no top in the downtrend. The chart using the indicator has no price gaps, as a new candle opens at the middle of the price of the previous one.
It is convenient to determine the end of the correction on these charts – when the trend is weakening, bodies of the candles become smaller, and the shadows grow; color change to the opposite is a good signal to buy/sell.
Delay of the indicator signals can hardly be regarded as a disadvantage, problems can occur only when working on the periods of M1 and M5. In most cases, the slow response of the indicator significantly reduces the number of "false" signals and will not let you mistakenly open against the market.
Social button for Joomla