

")
Murray indicator is suitable for trading both along the trend and against the trend. Its levels can be used to determine the following points:
- profit goals for existing trading positions;
- prices to set stop-loss;
- major resistance and support for the trend;
- all levels of pending orders (entry, profit and stop).
Despite the fact that the Murray indicator can help define most of the levels the trader needs for trading, it is not recommended to make deals against the trend on the basis of the Murray levels. When prices are moving against the main trend, the Murray levels show optimal targets for stop-loss, but not for profits, and especially not for market entry.
It is difficult to give all the secrets hidden in such a simple-looking Murray levels in one article, but, nevertheless, this article covers all important things you need to know about them.
What the Murray indicator is: theory
To build Murray levels, the trader must configure the only required parameter P – it defines the interval for calculation, i.e. the period of time (calculation unit is 1 bar – H1, D1, etc.). The size of the indicator period affects the distance between its levels – the greater the P value, the wider the levels, and the rarer they respond to the fluctuations in the price. Assigning too big value to P, you will see the price very rarely crossing the levels, and they will most of the time remain unchanged. With too short period of calculation, the levels, on the contrary, will very often be crossed by the price for no particular reason, and their unpredictable rebuilding will confuse the trader even more.
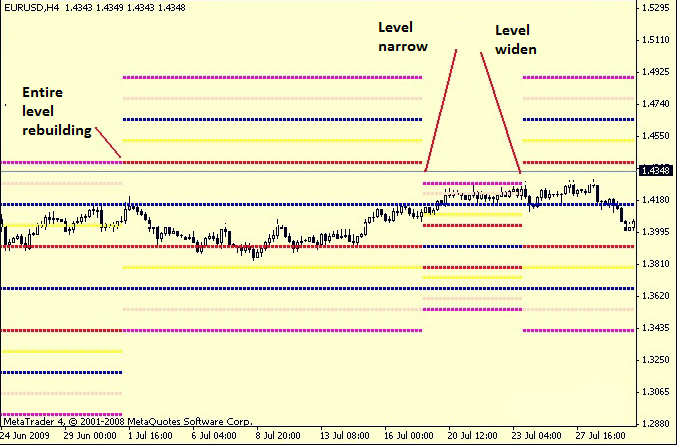
The author of the indicator set the period of calculation equal to 64. You can use a different value, the main thing is that it should be a multiple of 8 (the number of key levels). Modern traders often make the calculation period equal to 200 (not only here, but in many other indicators, too). Depending on the market conditions, the Murray indicator may sometimes narrow or widen, or rebuild the entire levels (for example, 4/8 to 0/8, 8/8 to 4/8). An example of changes in the levels is shown in the image below.
Murray indicator in practice
Before you start trading on Murray levels, remember what they mean.
- 0/8 and 8/8 are the extreme levels that are considered most important. They provide maximum support/resistance. An example of their work will be shown later.
- 4/8 is central and the second important level. There is no doubt in its support/resistance when the price is above or below it.
- 3/8 and 5/8 are levels of “premium” trading range, between which the prices can in any case be found 44% of the time. Depending on where the price was fixed, the direction of trading is chosen.
- 1/8 and 7/8 are relatively weak levels, which suspend or reverse the price if it leaps to them, otherwise the price will move further to 0/8 or 8/8.
- 2/8 and 6/8 by their strength follow 4/8 and can reverse the price.
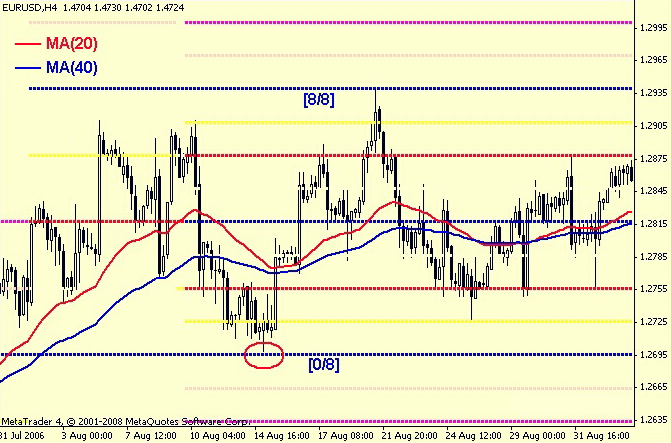
And here is a real example: see how the price behaves near extreme levels. Suppose that the market uptrend is identified (you can use any known method of determining the trend). Hence, at least a correction can begin at the level of 8/8, and at 0/8 the price will be supported in the case of reduction. Excellent chances to set pending orders are clear.
Social button for Joomla