

")
In search of optimal signals, the traders, together with analysts and mathematicians, came to the idea of creating combined, or so-called hybrid Forex indicators.
The standard set of indicators typically includes RSI dynamic oscillator (or Relative Strength Indicator) by Welles Wilder (compares the growth/decline of the price over the period), and Stochastic RSI created by George S.Lane in the 50s, the formula of which, except the Close prices, takes into account max/min of the price over the period.
Due to the fact that the RSI most of the trading time remains between 80-20 levels, the traders may be waiting too long for the signal to enter. Therefore, to increase the sensitivity of the oscillator, T. Chande and S. Kroll in their book “The New Technical Trader” proposed such hybrid Forex indicators as StochRSI, which operates on the basis of the RSI and the formula for the standard stochastic is applied to its data.
The indicator analyzes the current closing price of the tool in the price range and puts the results in some absolute corridor, beyond which the indicators does not go. The intersection of the waves of the indicator signals about the imminent reversal of the trend. Approach to the boundaries of the corridor indicates areas of excess supply/demand. It turns into the new oscillator that operates within the range from 0 to 1.
The authors themselves recommended RSI-option with a period of 14, but 9- and 25-period ones are also widely used. The stochastic is more mobile, and RSI is slower, but if both lines cross the boundaries of the 80/20 (or 70/30) areas, we get a more reliable trading signal.
Installation and setup of the indicator in MT4
Copy the file of the one of hybrid Forex indicators with the *.mql4 (*.mql4) extension to the expert (indicators) folder and then select from the standard menu “Navigator – Indicators” for customization:
Parameters and mathematics of the indicator
Hybrid Forex indicators parameters:
- RSI_Periods – period of the RSI oscillator;
- PercentK – parameter %K of the stochastic oscillator;
- PercentD – parameter %D of the stochastic oscillator;
- NumOfBars – the number of bars at the end into the history, for which the indicator will be calculated (0 – all the bars).
That is, we have twice smoothed Stochastic RSI – with an average length of %K (fast Stochastic) and %D (slow Stochastic), complete with 3-period simple moving average from %K. The above set of parameters lacks only “Slow down” option, as the RSI acts as this parameter.
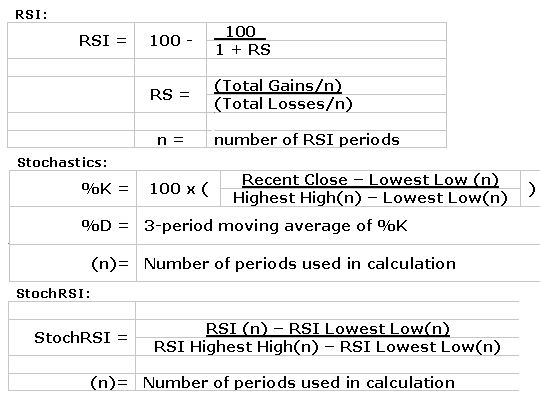
Formulas for calculating
Trading signals of the indicator
Going beyond the overbought-oversold boundaries: on the upward trend we get a signal to buy, if StochRSI goes from the level below 20 (oversold boundary), and then goes up. At a falling market, we get a signal to sell, if StochRSI declines from levels above 80 (overbought boundary), and then moves down. It is a reliable and the most popular trading signal among traders.
Breakthrough of the center line: movement above or below the level of 50 acts as a signal to confirm the current solution and reduces the likelihood of rapid speculative reversals. Movement above 50 (from the oversold boundary) is a signal to buy, and it is valid until its falls below 50. Signal for sure sell is movement from the overbought boundary (below 50 line) and works until the return of the price back (behind the 50 line).
Divergences (positive, negative): Positive upon confirmation above the 20 line is seen as a signal to buy, and the negative, with a decrease behind the 80 line, acts as a signal to sell.
False alarms: developers Chande and Kroll warned right away that the movements back (through the line of the received signal) indicate a possible error signal. For example, the movement back to rise above the 80 line indicates a false signal to sell, and the corresponding positions should be closed immediately.
Strong trend: like all the indicators of oscillator type, StochRSI may remain behind the overbought/oversold levels for a long time. Movement of the indicator above 80 line indicates the overbought condition, but it could also mean that there is a strong upward trend – and vice versa, a rapid drop below the 20 line indicates the beginning of a strong downward movement. Sharp dynamics to the 0 and 1 line signals about an active market, and the data from the combined indicator help making trading decisions.
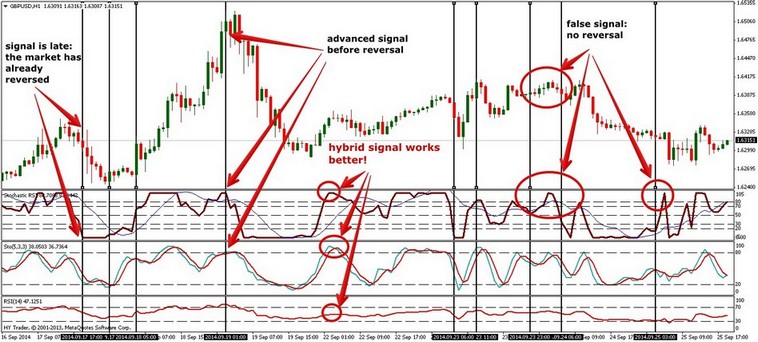
For comparison, the behavior of individual RSI and Stochastic indicators and hybrid Forex indicators like StochRSI are all shown on the same screen of the terminal:
Advantages and disadvantages
Options of the hybrid Forex indicators are always beneficial. However, the lines in the combined indicator became sharper and broken, and the intersection of 2 lines became less predictable. The main line (blue) runs more smoothly, and the additional (red) is a fast broken, so the fact of the intersection of these lines occurs at any time, even if there were no serious shots of the price in the market.
Stochastic is able to give more differences than the usual RSI line, so its (stochastic’s) signals arrive earlier, but more often they are less reliable. Of course, you can experiment with the settings and get a smoother operation, since the primary purpose of creating hybrid Forex indicators was an attempt to increase the sensitivity of the various options of the relative strength index.
The indicator is very useful during the “ragged” market, or at the end of the trend – in the middle of a strong market the value of the signal drops sharply. The indicator shows the periods clearly enough, but sometimes it gives a false “breakthrough”.
Use in trading systems
In their mathematics, all of the options of StochRSI are more like Stochastic Oscillator, which means that all the possible points of intersection of its lines can be considered the signals for trading.
The moments of 80/20 (or 70/30 – it’s up to the user) levels crossing, and areas of high demand/supply, and the intersection of the 50 mark as a signal for the position reversal all can be interpreted as an offer to open an order.
That is, we can construct a scalping strategy from the “Always in the market” family. Such trading systems usually lack stops and take-profit, as the orders to reverse the position play their role.
And in conclusion...
It is important to remember that StochRSI is a kind of derivative, “Indicator from indicator”, so its movement to the limit areas does not mean that you should immediately sell/buy.
After all, it is only intended to predict extremes of the standard RSI before the relative strength indicator reaches those values, so a hybrid is far enough from the actual movement of the market price and often delays.
When using StochRSI, the confirmation signals from other indicators, such as chart or volume indicators, are necessary. Otherwise its original sensitivity and a lot of false alarms will only prevent you from making trading decisions.
Social button for Joomla