

")
Professional analytical and trading terminal with innovative functionality from AmeriTrade Holding Corp., except for the expanded information, offers all types of standard indicators for Thinkorswim, as well as the possibility to create and enable the individual variants.
Thinkorswim (TOS) program complex was created for option trading, but is now actively used to work in the stock market, as well as for transactions with futures and common currency pairs. The interface is very different from the usual trading platforms, requires average knowledge of English as a minimum, and some time to master, but the result will be an in-depth understanding of the market and the ability to use the latest analytical methods. Data on the current prices and volumes (orders feed) of the spot market, futures and stocks is received in the terminal in real time absolutely for free, which gives a special value to the use of indicators of trading volumes and calculated price levels in the terminal.
The module of the work with indicators is quite simple. General view of the desktop screen in the “Chart” mode with installed indicators of various types is shown below:
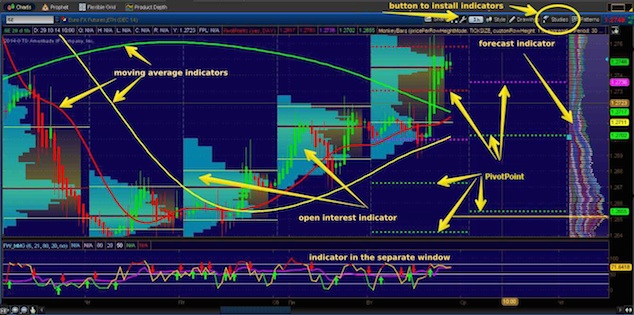
Indicators for Thinkorswim, which by default are supplied with the terminal, are of all possible options – trend (also separately for bullish or bearish market), chart, time, candlestick, signal, special for shares and options, volume indicators and oscillators with advanced settings and options of combinations.
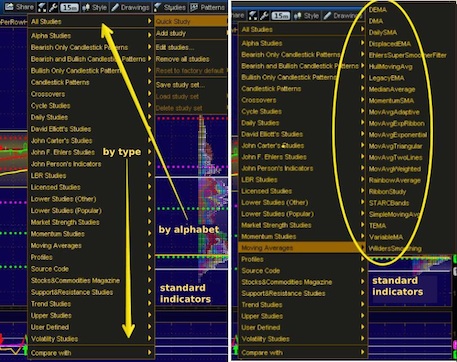
You need to go to the option (button) “Studies“ in the “Chart” mode, in the menu that appears you will see the embedded standard indicators grouped by alphabet (“All studies“) and groups. You can select and add any of them by pressing the buttons “Quick study“ (fast installation) or “Add study“ (add the tool):
To make additional configuration before placing the indicator, after selecting the “Studies“ option, select Edit mode (“Edit studies“) and see a window like this:
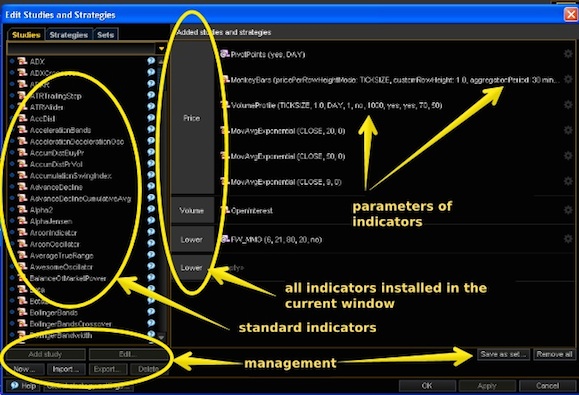
You can see all indicators installed in the current “Chart“ window, the left panel provides options for standard indicators, which can to be installed by selecting the desired indicator and placing it in the current list with the “Add study“ button at the bottom of the left panel.
When you select an already installed indicator from the list, the mode of its fine tuning is activated. Below is an example of setting the exponential moving average:
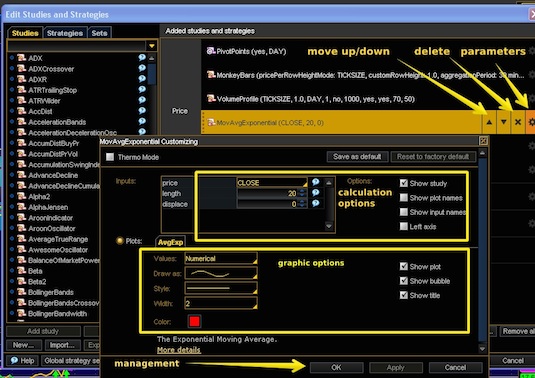
As we can see, the settings are basically no different from the usual MetaTrader, there are also modes to save the current settings as the default option (“Save as default“) and reset of the selected settings of calculation and charts to the previous mode (“Reset to factory default“). Settings are saved by using the standard control buttons.
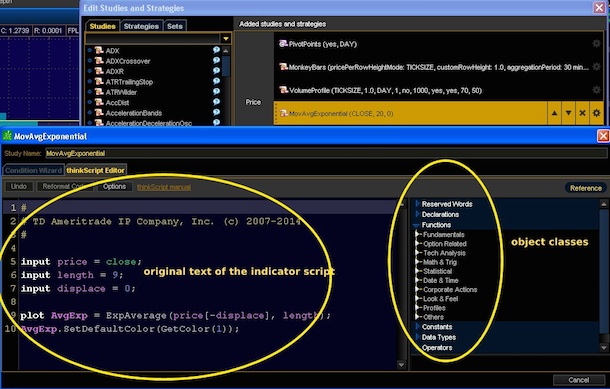
You can view the text (script) of the selected indicator in the “thinkScriptEditor“ mode in this window, the right panel of the editor shows the main classes of objects for programming under the TOS, their structure is similar to the main classes of MQL4(5) objects:
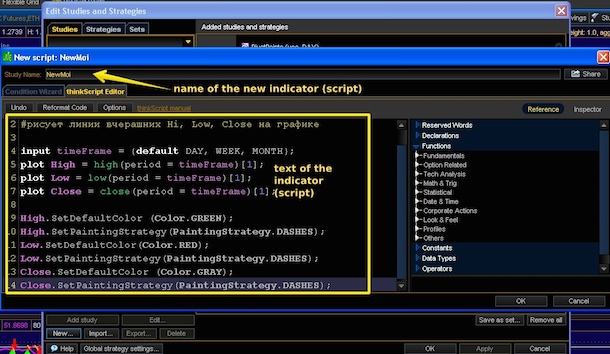
If desired (and if you can!), you can create your own indicators for Thinkorswim, syntax hardly differs from the embedded MQL4 editor in the usual MetaTrader4(5). Creation of the new module is as follows: “Study“, “Edit Study“, “New“ and further in the Edit mode. Enter the draft name of the script in the “Study Name“ field immediately, because after the first save it cannot be changed. Write (or paste from the clipboard) the executable code of the indicator and save. It also offers the built-in tutorial on programming for Thinkorswim – “thinkoScript manual“ – in English.
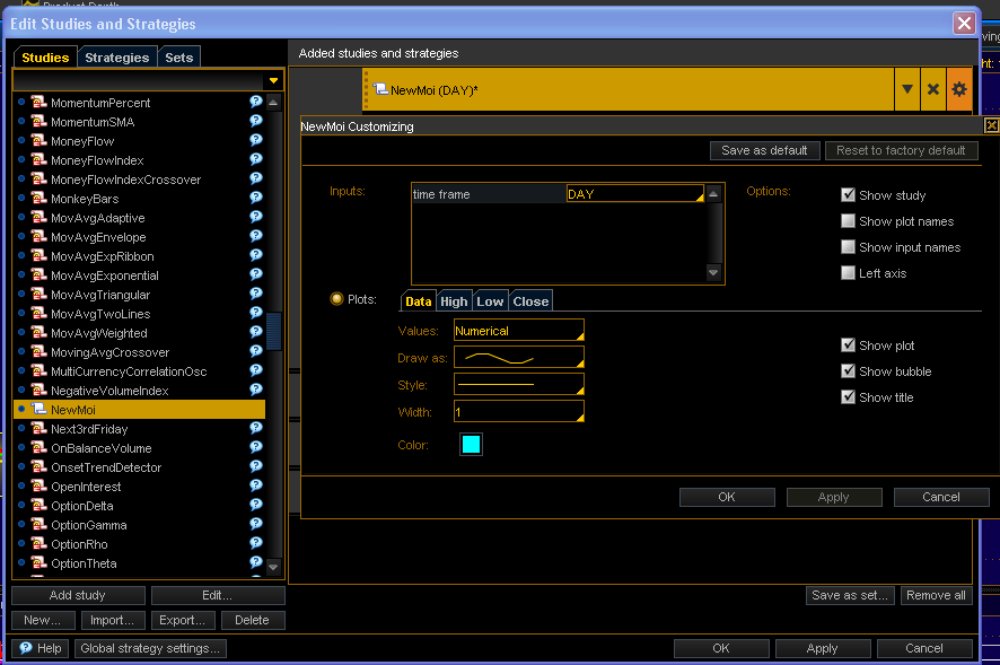
After a successful save, your newly created indicator for Thinkorswim should appear in the list of indicators suggested for installation (on the left). Next, enable it to the current chart by the conventional method. The parameters you assigned to the indicator should be visible in the standard settings window.
Indicators can be imported from external sources, in spite of the standard programming language, the files must have the extension *.ts. Conversion of *.mq4 files is allowed but may not be very profitable – it takes a lot of corrections, therefore it is easier to rewrite simple indicators. Export is possible to external files for later use.
Important: do not confuse volume indicators and volumes indication as a terminal mode!
If you need to add (or remove) the volumes indication to the current chart, select the “Equities” tab in the mode settings from the main control panel (in the form of a "wrench" key), and the desired tool type – stocks, options, futures or spot market ("Forex”), and add (or remove) the check box in the “Volume” option. Indication is performed in an additional window below the main chart tool. This is a complete analogue of the same mode in MetaTrader, that is, the tick volume (number of transactions per time unit). The real "size" of the volumes traded is only visible in the exchange depth and the price feed (to the right from the main chart).
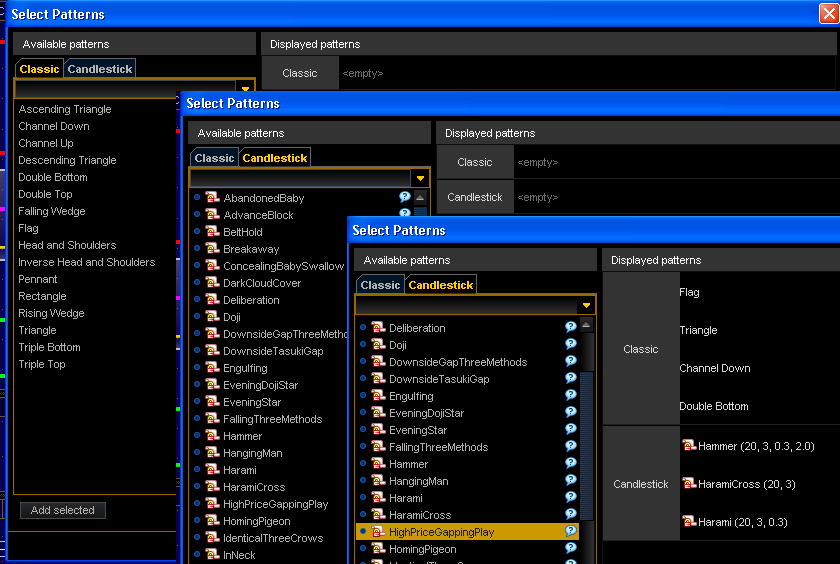
The so-called arrow indicators for Thinkorswim are worth of being mentioned as well. They are rather not indicators but special programming mode, which helps in the search for chart patterns and standard combinations of candlesticks directly on the chart of the trading tool, pointing arrows on them or selecting them in any other way.
You can enable this option by clicking “Patterns” button in the main panel, setting the check box at the display mode “Show patterns” and selecting the appropriate constructions with the option “Select patterns...”. The proposed window has a choice: “classic” chart patterns (“Classic”) or candlestick patterns (“Candlestick”). You can only select the certain patters or combinations and they will be displayed on the current chart, after which they can be further customized in the standard settings window, just like for conventional indicators. Window with some selected patterns and candlestick combinations looks like this:
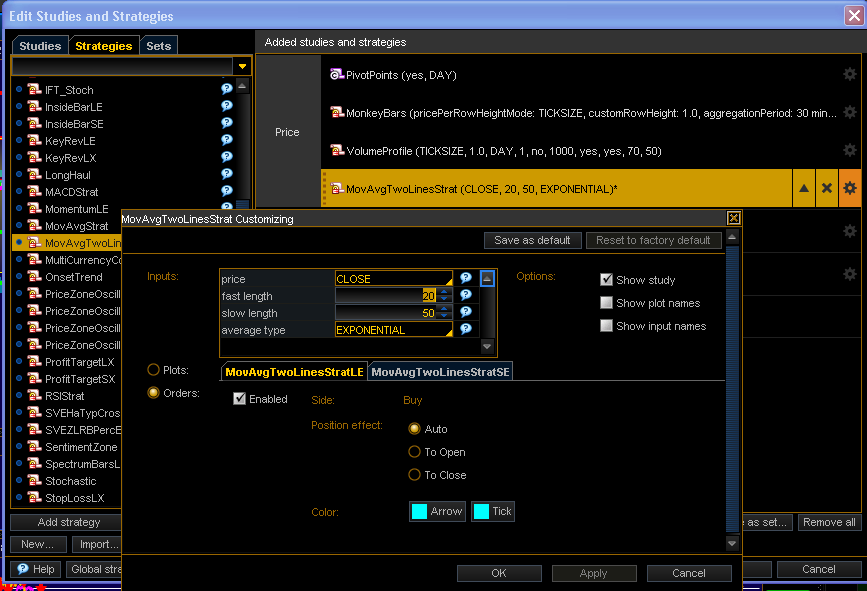
Another mode that can be attributed to the indicators for Thinkorswim is signal indicators. If the goal is to build some semblance of a trading strategy from a set of indicators, you can use their signal combinations. The path to such a mode is as follows: from the main “Studies” further to “Edit studies” and select the “Strategies” tab in this window. For example, select “MovAvgTwoLinesStrat”, which should give signals to buy/sell at the intersection of the said moving averages with a period of 20 and 50.
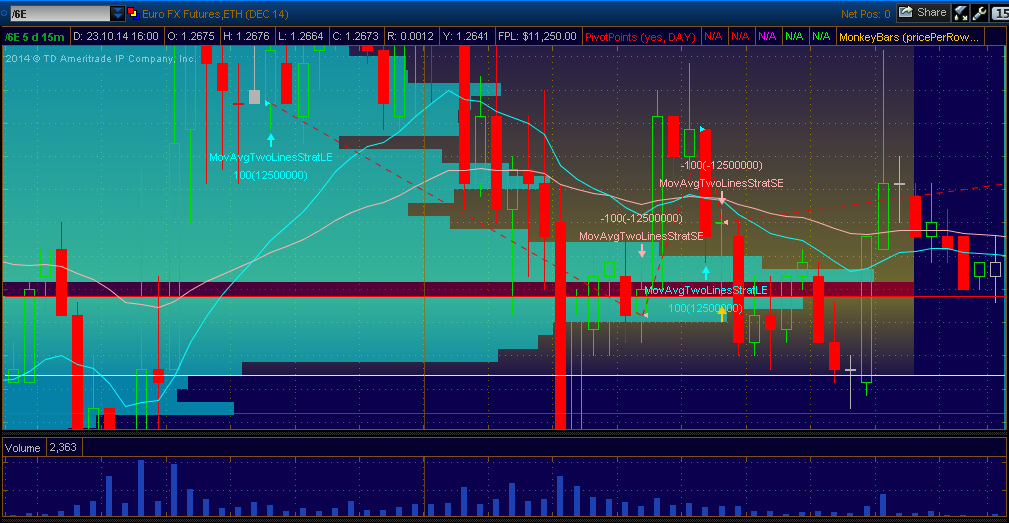
The result of this combination on the current chart:
And as a conclusion...
Indicators for Thinkorswim differ by extraordinary accuracy and clarity due to the real flow of trading volume with virtually no delay. Most of the combined stock indicators are only offered in a test or a paid version, but are usually open source, you can study them, reprogram for yourself and make them an effective tool for successful trading.
Social button for Joomla