

")
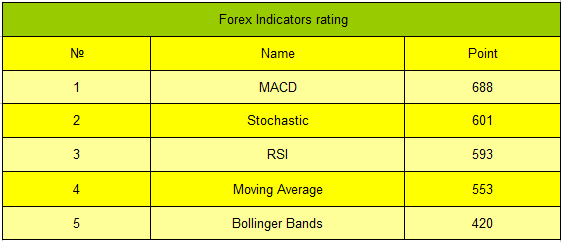
Each trader will be interested in building the trading system of his or her own one day. In fact each trader forms this system in his trading activity. Using trader calculator, each trader finds the best full lot volume as well as favorite trading instruments, indicators and consequently advisers. Each trader knows where to gain more benefit. The systemized plan which one follows is a trading system already. And spreads as well as credit leveraging allow making the trading system of the trader more effective. As a result, each trader finds one question - which indicators could be used for trading. The answer is in the indicators ranking.
The indicators ranking comprises those indicators which do not rewrite history. It means that it gives the possibility to analyze trading history, either one-day history or week-long and one year-long history. And this analysis makes possible to see the indicators volume which they had at the moment of trading. This feature of indicators gives us possibility for easy testing of trading strategy effectiveness for the long-lasting period of time. Moreover it shows that indicators signals will be predictable further in future. Indicators of this kind as well as indicators ranking are described below.
Classic Forex indicators
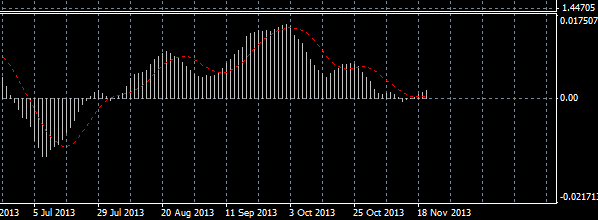
There are several reasons why indicators are called classic. The main reason is that they were successfully used by thousands of traders in very different types of trading strategies. Second reason is that resting upon these indicators, many other indicators were created, but their content is still the same with the classic ones. Indicator Forex MACD can be called such an indicator of this type.
The full form of this abbreviator is Moving Average Convergence/Divergence. Being included in indicators ranking MACD occupies the first place in it since it is used more frequently then others. A red line which is called a signal (neutral) line, illustrates the possibility for transaction. And, if gray lines, which form the indicator’s histogram, are located above the neutral level, above the red line then it is better to purchase, and if they are under the red line it is recommended to sell.
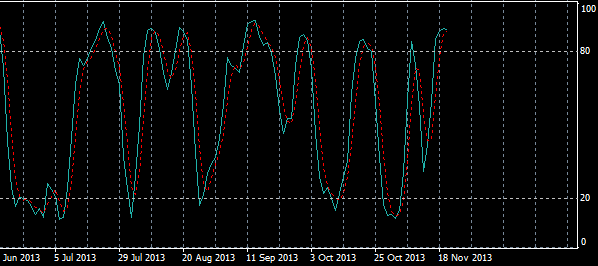
There is also a stochastic oscillator. Being included into indicators ranking, it worthily occupies the second place, as it is the same as popular in use with MACD. Indicating those zones of overbuy and oversell it helps to observe the end and well as the beginning of a new trend. It works on the principle that the purchase can be done provided that the indicators lines fell down under the level of 20, and then grown while the red or signal line runs above the gray dotted line. It is preferably to sell when the stochastic falls down right after it reached the level of 80, when the signal line lies under the gray one.
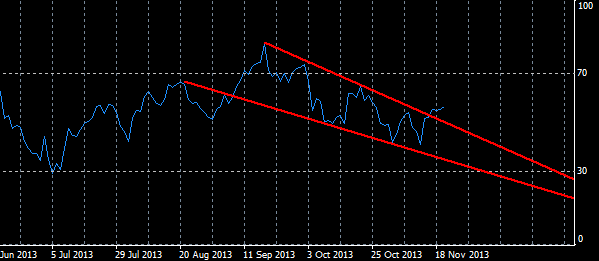
RSI indicator (Relative Strength Index) occupies its prominent place, being included in indicator ranking and being the indicator of relative possible strength of the currency pair. Often it is use in tandem with any other indicator, helping to determine the trend in the exact period of time as well as to predict its end. RSI on his graph often forms classical forms as those which occasionally appear on the price graph. The principle of their operation is quite similar. It helps traders to analyze its graph and to compare it with the price move.
Indicators described above help us to understand, that their implication is not so complicated as it may seem to be at the beginning, they all are widespread and occupy the highest positions in indicators ranking .
Social button for Joomla