

")
MA indicator is classic and the very first trend indicator. Its abbreviation stands for Moving Average, also known under the slang name "moving". Many professional traders use the MA indicator in one form or another, and this is not surprising, since there is nothing more objective in the market than the average price for the period.
There are many variants of building moving averages, but the most commonly used are the simple one – in calculation of which each bar has the same weight – and exponential, in which the last price has greater impact on the total value than the previous ones.
What must be taken into account when customizing the MA indicator
The beginners are recommended to start with the options listed above and not to give themselves a hard time with complicated formulas, especially taking into account that they are included in the standard package of MetaTrader terminal. One of the advantages of the “movings” is ease of set up – for example, there are only four parameters that should be specified:
-
Period – the number of bars (candles), the prices of which will be taken into account. Please note that they are not time units, as the beginners start getting confused on minute charts;
-
Offset – shift of the obtained line by a specified number of bars. If positive, the calculated chart will move to the right, if negative – to the left;
-
MA method – this list specifies the building methods, as discussed above;
-
Apply to – selection of price or an instrument, the values of which will be used as the basis for calculation. This item should be considered in more detail, the figure below shows the corresponding expanded list:
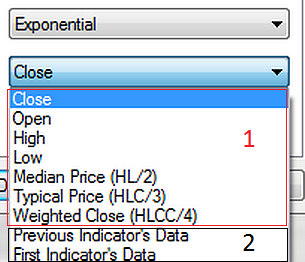
While the block No.1 is all intuitive – it is the different versions of the basic price, the block No.2 provides ample opportunities to strategies building. If you select «Previous Indicator Data» or «First Indicator Data», the "moving" will base on the previous or the first indicator in the window, respectively.
Variants of strategies based on MA indicator
The very first technique the beginners face offers trading at the crossing of the fast and slow indicator lines. Objectively, this approach is rational, because the short-term trend is always ahead of the long-term one, as well as the prices remaining above their average value for a long time show a trend reversal. The figure below shows an example of such signals:
For setup, the exponential movings with periods of 120 (medium-term trend) and 12 (short-term) bars were used; in this case, one bar is an hour, as there were no situations that no quotes were received within an hour. Disadvantages of such strategies lie on the surface – first, a large number of false alarms during the sideways is formed, secondly, the signals are significantly delayed with respect to the trend itself.
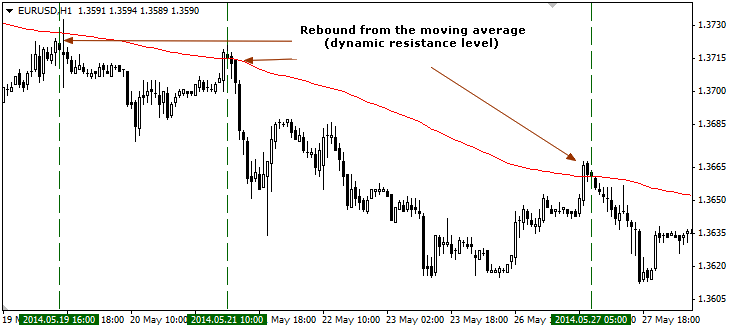
It makes no sense to try and fix the disadvantages listed above, as they result from the formula features, so you should either rely on statistics, balancing between signal “delays” and expectation, or to change the approach – in particular, one of these options is to abandon the fast line and to trade at rebound and the breakdown of the medium-term trend. The figure below shows an example of entries at the rebound:
In this example, the moving average is a dynamic resistance level, so patterns should be considered as signals to sell. Compared with lines crossing, this approach generates more accurate signals, but under one condition – if the trader has enough experience to distinguish the true rebound. When trading on the breakdown, the similar approach is used:
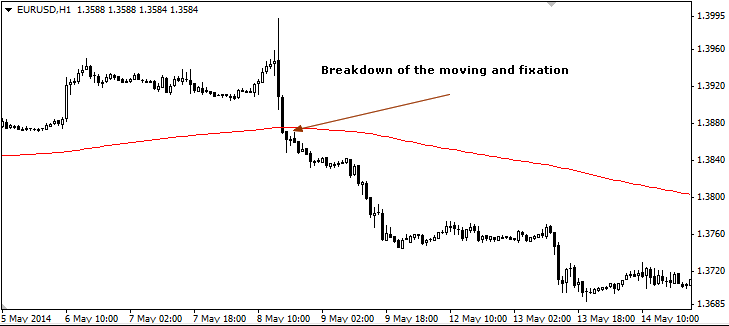
The last option is the most difficult of all the above, since the probability of a trend reversal is generally lower than the survival probability – moreover, only the experienced speculators can recognize the true breakdown, given the fact that the classic candlestick patterns do not work well in the modern market and you must use the measure analysis.
In conclusion, we would like to note that the MA indicator can also be used only to identify current trends, without trying to use specific signals. In this case, only the angle of a moving with a large period of calculation is taken into account (usually 200 days), while signals are generated by other indicators or methods.
Social button for Joomla