

")
With any style of trading, it is recommended to start with the analysis from higher timeframes, as trade becomes more peaceful and profitable. But the standard features of the terminal do not give the opportunity to see how the events develop on different timeframes in one window, while the Mcandle indicator can.
This indicator is indispensable in a situation where you just need to quickly assess the situation – for example, on the daily timeframe, – and then return to the working time interval. Algorithm of its work is very simple – by and large, the indicator simply "adds" a certain number of minute candles (defined in settings) and builds a candle of the corresponding timeframe.
Mcandle is freely available and everyone can experiment with it. To install it, simply place the file M_candle.ex4 to the “indicators” folder and restart the trading terminal. To launch it, simply drag Mcandle from the browser window to the price chart.
Mcandle indicator: setting and preparation for work
Indicator settings allow you to customize it to display any timeframe (on top of the one used by a trader). In general, the list of options is limited:
- TFBar – this parameter sets the additional timeframe that will display on top of the main one. The indicator works with a minute timeframe, so in order to get, for example, h1 candles, you should set the value of TFBar as 60, for h4 – 240, and for day timeframe – 1440;
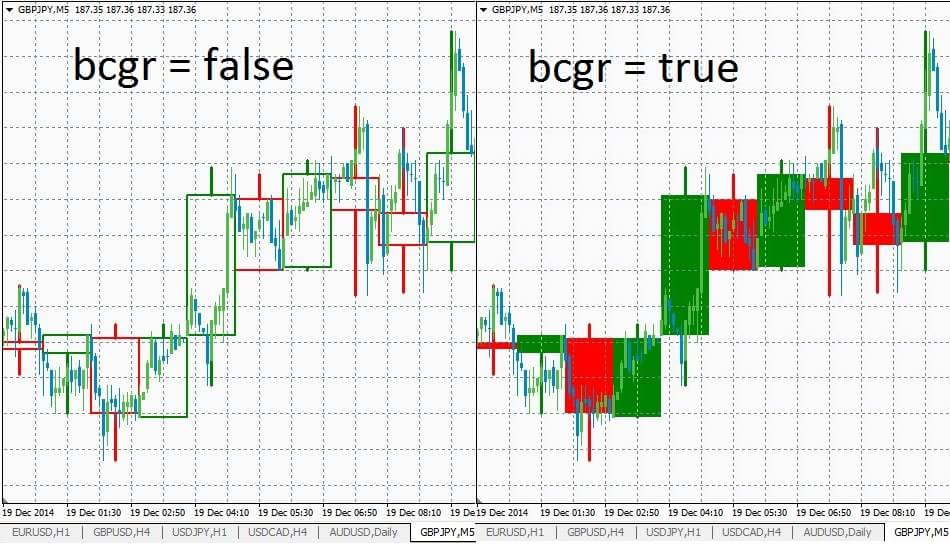
- bcgr – the default value is false, and candles of the additional parameter will not be colored, i.e. only the contours of candles will be visible;
- NumberOfBar – the number of candles that will display on the screen is set;
- ColorUp – the color for the bullish candle (which has Open price higher than the Close price) is set;
- ColorDown – sets the color of the bearish candle.

After you have installed the indicator, you won’t be able to enter its settings for the second time, as well as remove it. To construct the candles of additional timeframe, the Mcandle indicator uses a standard set of trading terminal figures (rectangles and vertical lines).
To remove the indicator, you can select all objects in the menu of the list of objects (opened by pressing ctrl+B) and delete them. But you will have to do it on each timeframe, starting from m1, so it will be more convenient to just close the window and then re-display the chart of the desired currency pair.
An example of using the indicator
Sometimes a candle is formed on a larger timeframe, which indicates a close trend reversal or at least a correction. At the same time, small time interval does not indicate this. If you don’t constantly monitor the larger timeframe, you may miss the signal.
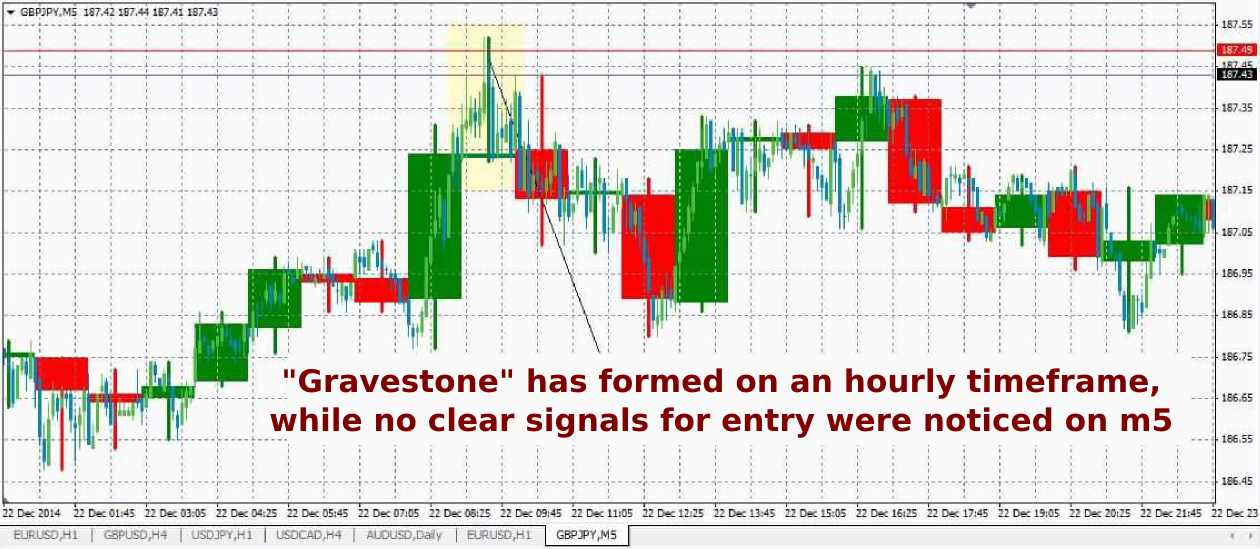
In this example, a big shadow on the top of h1 indicates that the bulls are faced with an obstacle when trying to conquer new heights. At the same time, the m5 time interval says nothing about the upcoming descending movement.
However, you should not enter the market only by the candle combination on the additional timeframe. The probability of working out such a signal is too small, it is better to use it as an addition to the existing rules of the trading system.
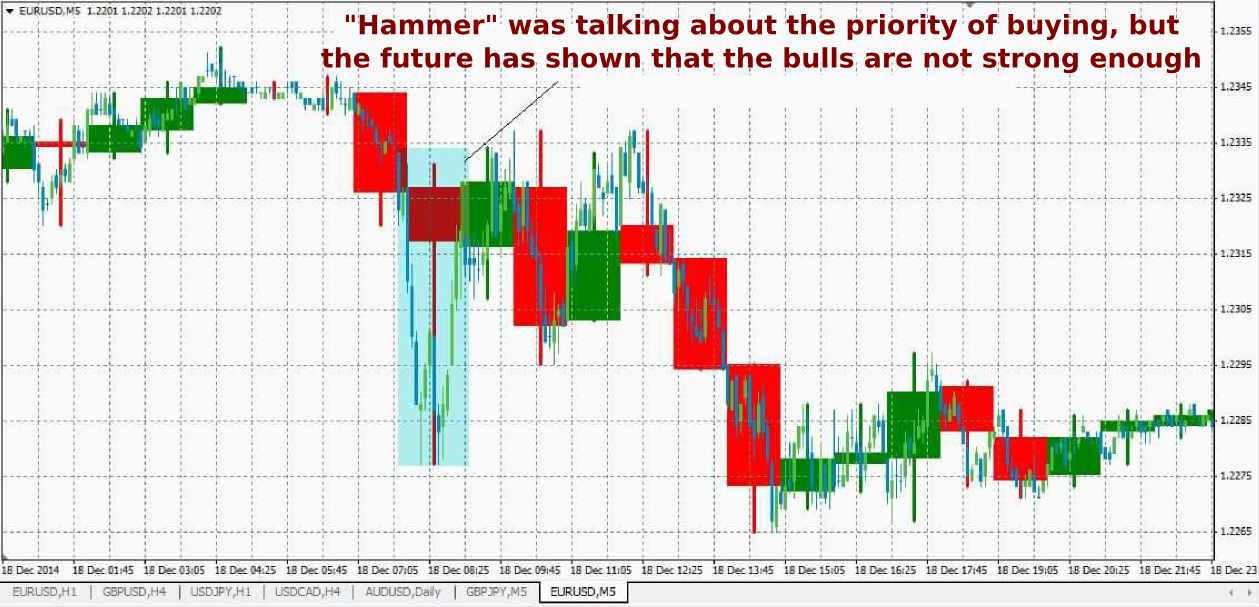
The Mcandle indicator is not a panacea, but rather a "cure" for forgetful traders who simply forget to check the situation on the higher timeframes. Therefore, you shouldn’t trade only on the basis of its signals. The example illustrates a situation where a good combination on h1 failed to work out.
Recommendations on using Mcandle
The indicator has no restrictions on currency pairs or timeframes. You may want to try to use it even on the daily charts, although it would make no sense. We can only give a few tips on how to use it:
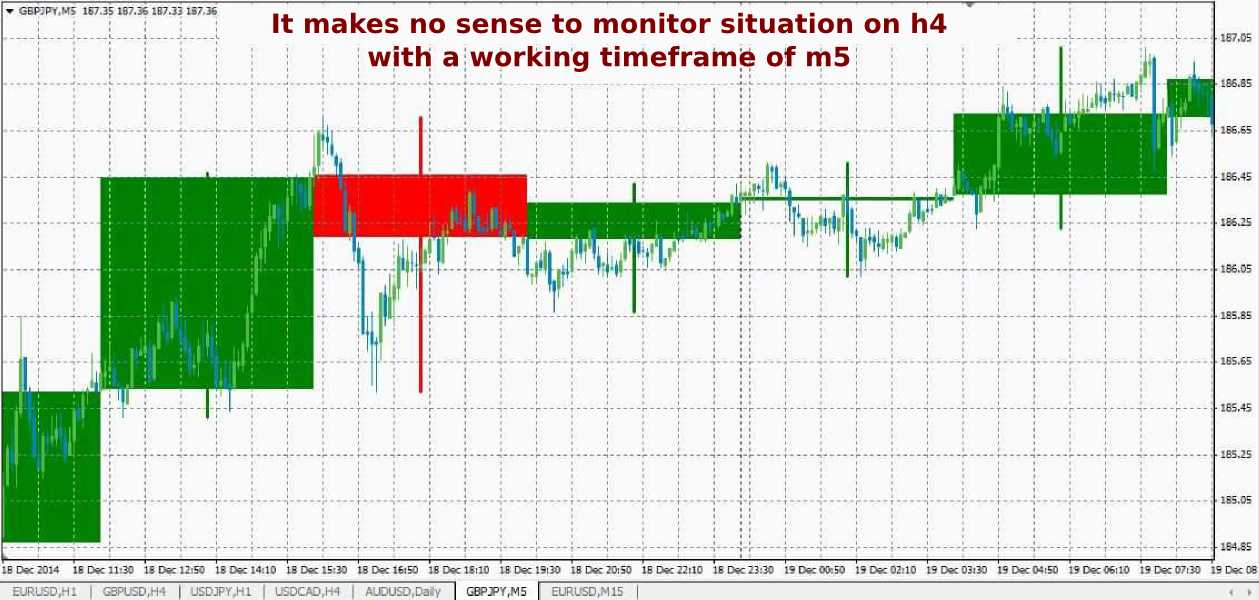
- you need to follow a reasonable ratio between working and auxiliary (the one which "draws" the indicator) timeframes. Trading on the m5, we can recommend to monitor the situation on h1, but monitoring the picture on the D1 or h4 doesn’t make much sense;
- signal obtained with additional timeframe needs to be confirmed.
If desired, the Mcandle indicator can be used not only to obtain additional timeframe, but also to draw custom time intervals. It can give you any timeframe in increments of 1 minute.
All you need to get a custom timeframe is to set the desired value in the TFBar field. For 2-hour candle, the value should be 120, for 3-hour – 180. You can get even 7-minute candles, but it is better to use the standard values.
Summing-up
Mcandle is rather a tool to complement the existing trading system than the source of signals for transactions. Thanks to this indicator, you can monitor developments on other timeframes without leaving the working timeframe.
The use of Mcandle makes sense only when trading on the timeframes up to h1. At the tense intraday trading, the ability to instantly assess the situation on several timeframes is worth it.
Moreover, when switching to a different time interval, the chart representations are sometimes incorrectly displayed (this often happens if you do not set the anchor points for trend lines). Displaying the additional timeframe over the main one can solve this problem.
At the same time, if the trading style is calm and the deals are made on time intervals from h4 and higher, the Mcandle indicator can be considered almost useless. It is unlikely that a trader working on h4 will check the situation on the D1 or weekly candles from time to time.
Social button for Joomla