

")
The ability to analyze the price movement on multiple timeframes has always been one of the conditions for success and a sign of a professional approach to business. Multiframe MTF indicators allow to display the characteristics of different periods on a single screen and effectively evaluate the whole picture of the market.
A trader who constantly monitors the market is experiencing a serious visual and mental stress, trying to reach a huge amount of visual information. The deal is always opened on a small period, so failure to notice a change in the dynamics of the instrument on a larger timeframe will make you either to skip a favorable entry point, or miss a reversal and go against the trend. It is very difficult to monitor many screens with different tools, indicators and periods, especially if you need to switch between screens. All this is distracting and increases the risk of a mistake.
MTF indicators have been specifically designed for traders who make decisions based on the current analysis of several periods and calculations under several methods. In addition to the display of the reference and calculation information, such indicators may show a real understanding of market trends and even give trading advice.
Mathematics, installation and optimization of indicators
The unique features mainly relate to the time processing of the typical information. That is, any types of indicators may be multiframe: trend, volume, oscillators. They work on their standard mathematics, but the common calculation mechanism for each type of indicator harvests information from multiple periods, and the standard calculation is performed separately from them. Construction of graphic elements is also performed for each timeframe and in most cases the appropriate set of charts and signals is combined into individual pieces of information and highlighted with colors. In addition, sometimes MTF indicators have additional analytical calculations embedded:
- Percentage trend expectations;
- Percentage ratio between periods;
- Price expectation;
- Pivot levels;
- Average volatility;
- Recommended entry points and levels of profit/stop loss;
- Forecast of the future trend in the different periods.
Important: performing additional mathematical calculations requires time and technical resources, so all indicators delay with visual display to the screen.
Installation of the indicators is conducted as usual – by copying the compiled *.ex4 files to the directory //MQL4/indicators/. Most of them are a set of several indicators, each of which is responsible for its unit calculations, so they are usually combined with one template and are recorded together to a separate directory.
The results can be displayed at the screen both in the main window of the price chart and in a separate window. Customization of MTF indicators is not much different from the standard, but there are certainly options (or list) of additional periods, and sometimes a list of currency pairs, for which additional analysis will be carried out. Below are the installation options for the version of the famous multiframe stochastic MTF_Stocastic_alert, in which the appropriate time in minutes should be specified in order to select an additional period.
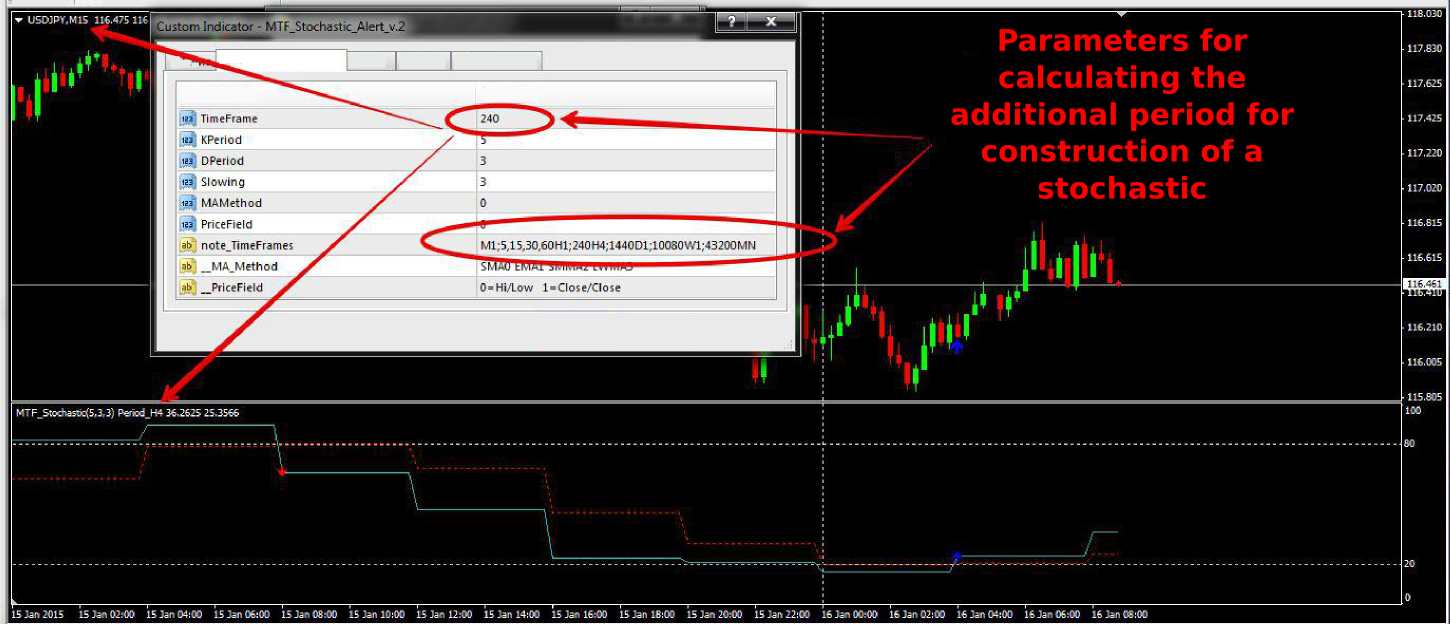
Important: the set and the number of settings is determined by the type of the indicator, but for MTF indicators you should necessarily choose “Allow import dll” and correctly configure additional periods.
Main types of indicators
Multiperiod indicators are presented in all standard classes; many of them are complex, i.e. they combine computational and background information with graphic elements. The following groups can be singled out:
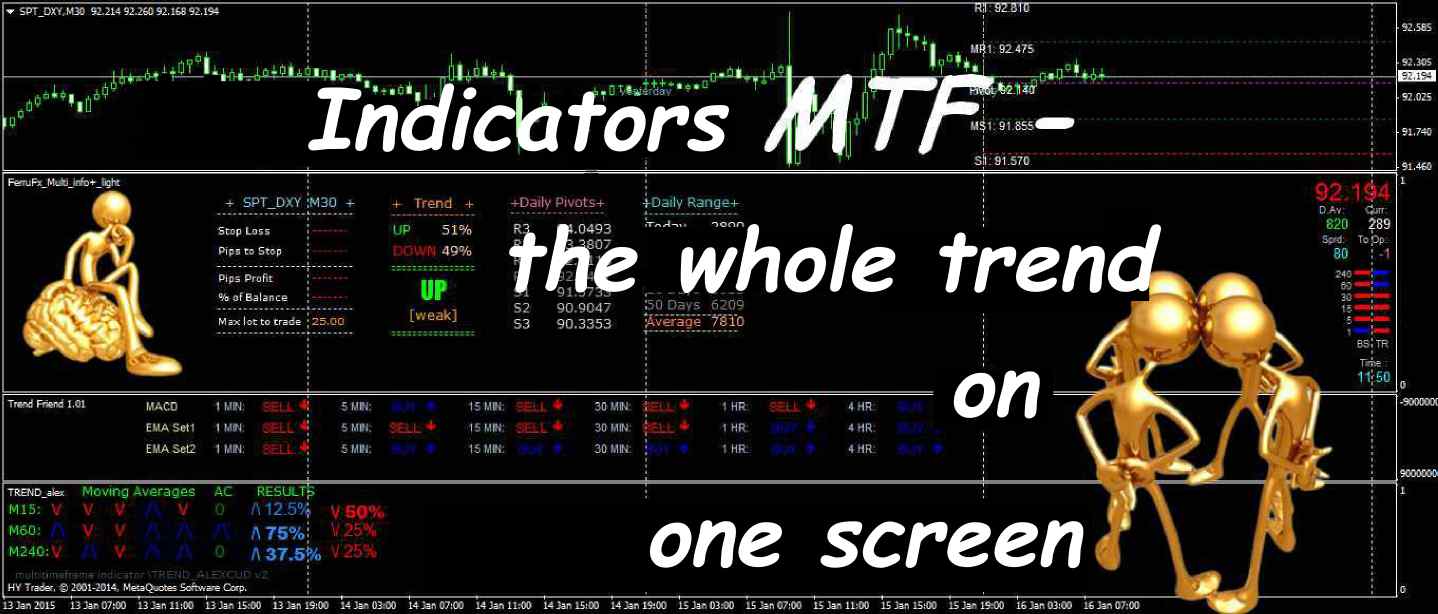
Informational – display the data and additional information without signals and chart constructions. A classic example is options of Crazypips_Multi indicator, which consists of 9 individual indicators combined by the crazypips multiframe.tpl template and comes shareware only for the period up to 30 days. Screen with this indicator is full of useful information, but is not suitable for trading – only for viewing. Aside from the calculated data, the current price of the instrument is displayed as well as the spread and the time until the end of the current (in this case – 1H) candle.
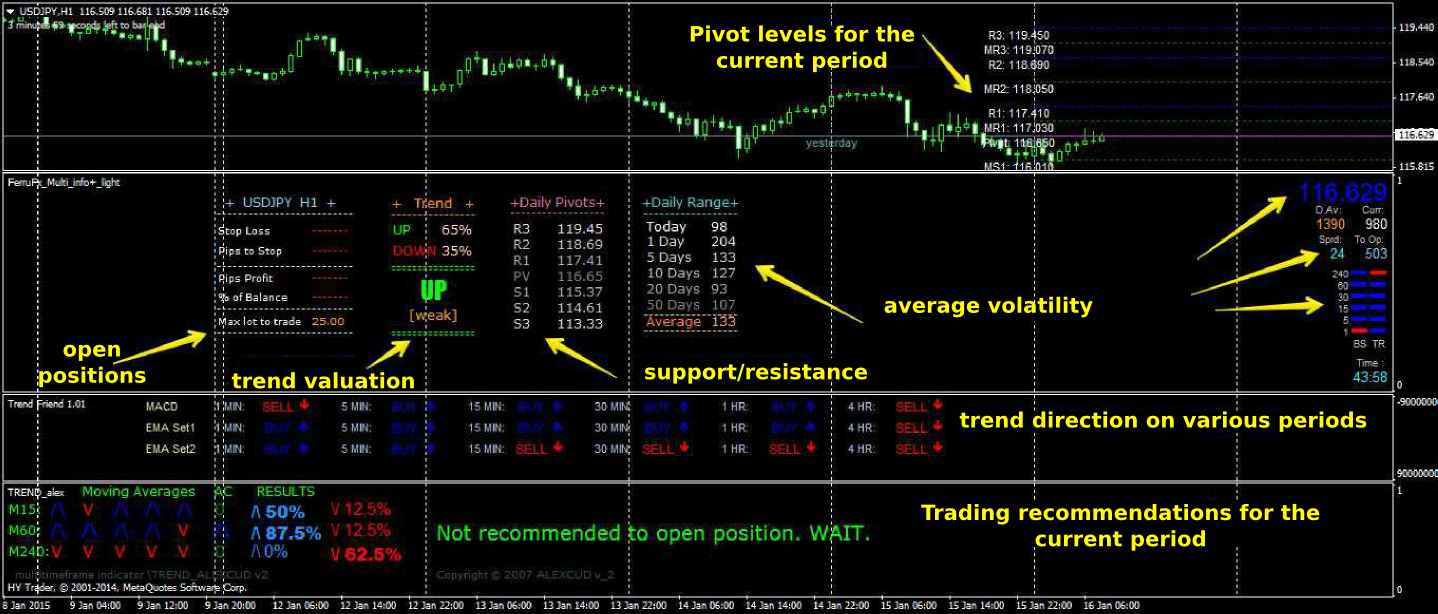
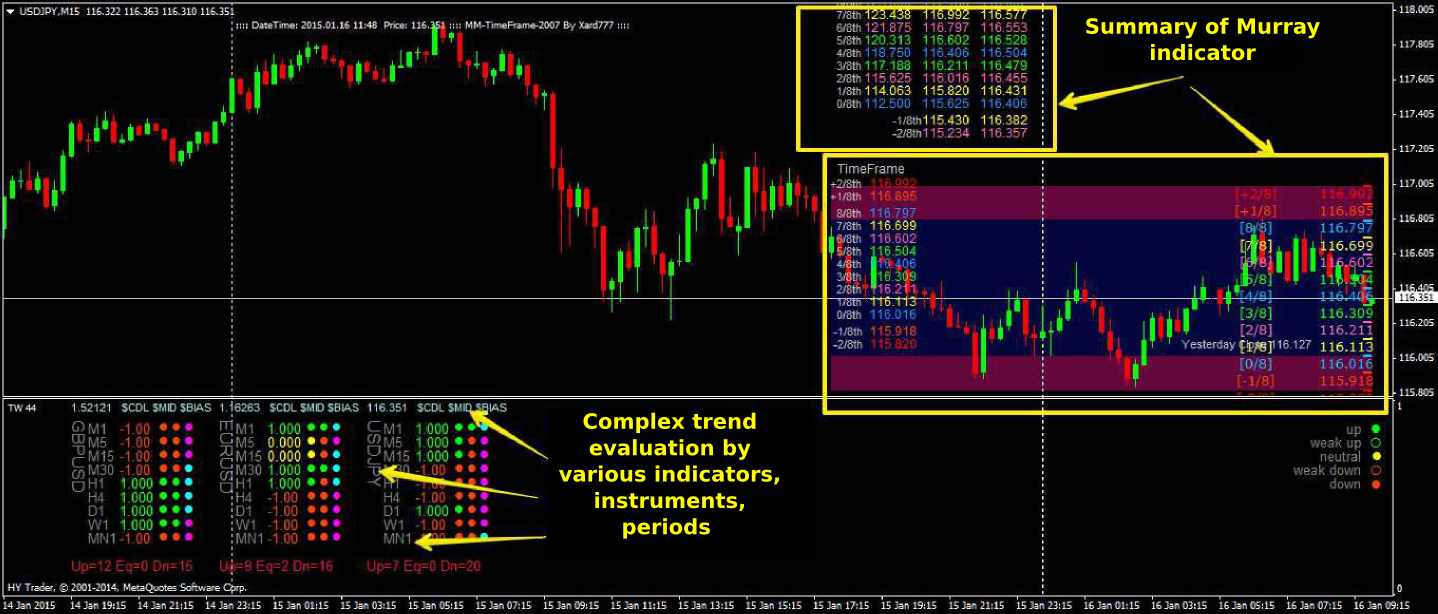
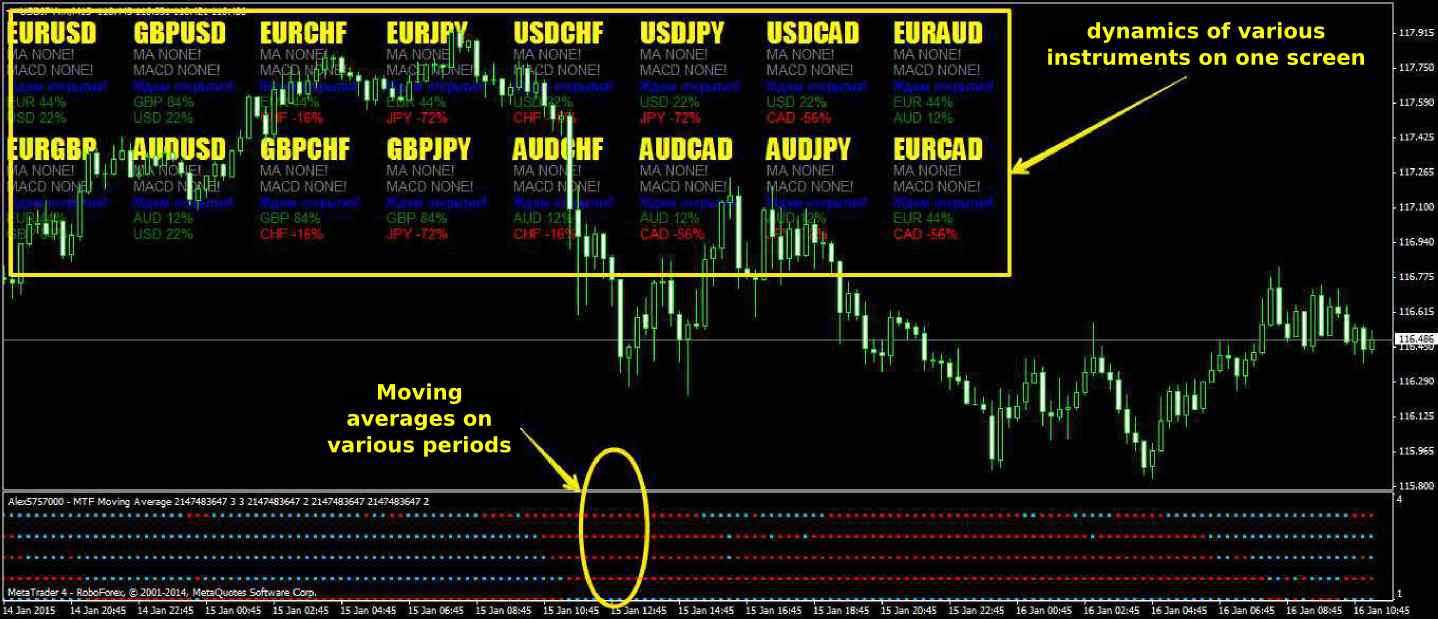
Another example of the display of the analysis on a single screen, including trading recommendations and calculations on several standard indicators (which do not even need to be enabled on the chart – the calculation is done automatically):
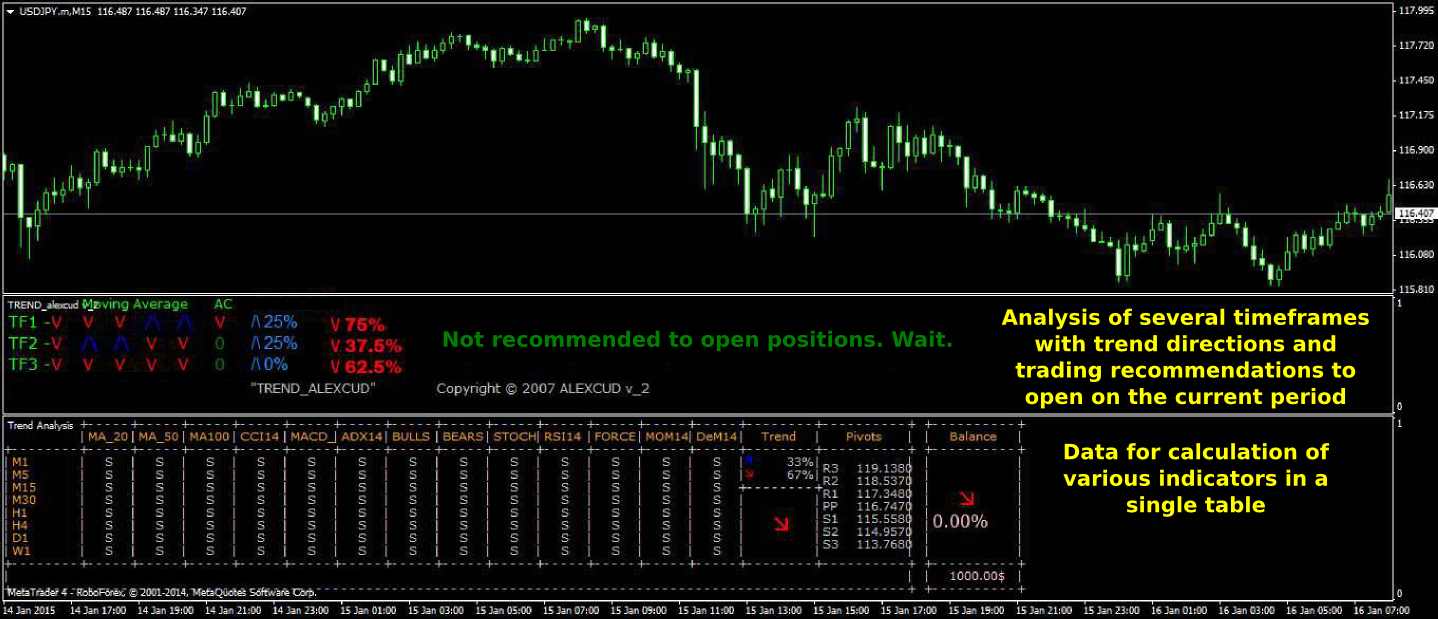
Sometimes the calculated data of conventional indicators is displayed, in order not to build them on a real chart:
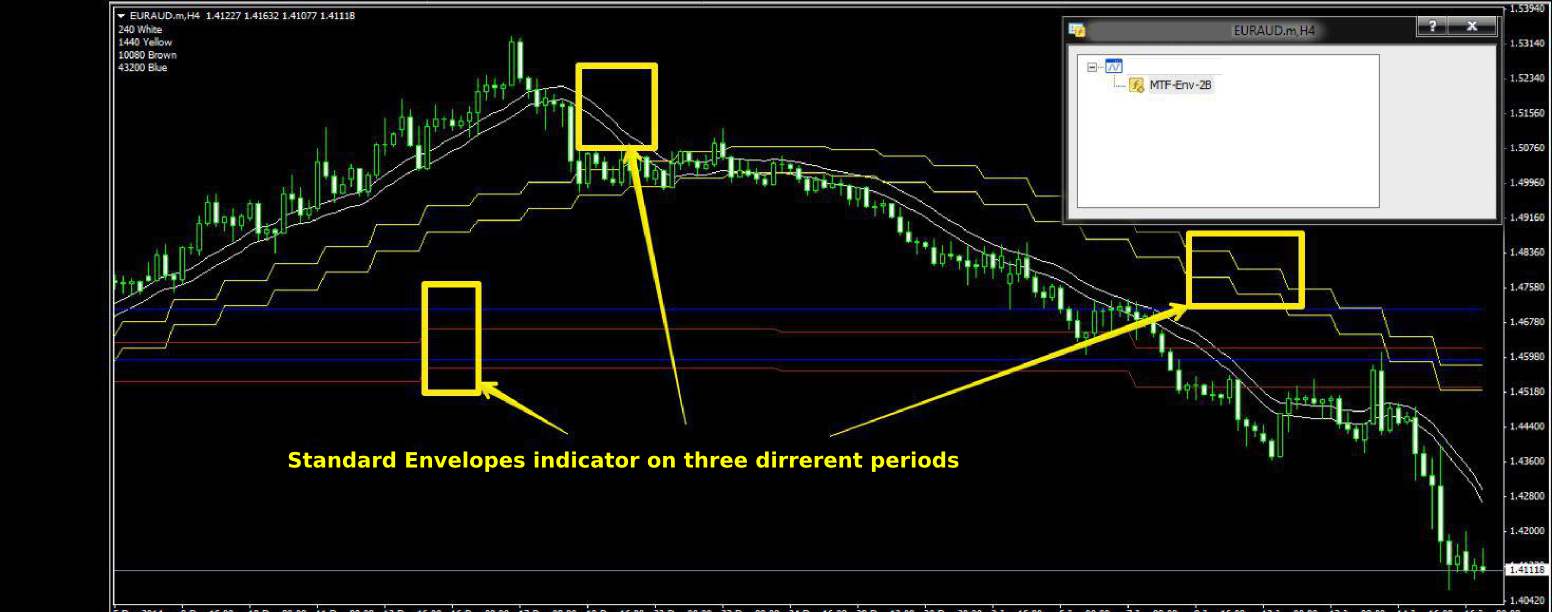
Graphic MTF indicators – display the charts of the same indicator on one screen, but on different periods. Here is a standard Envelope with the extra period.
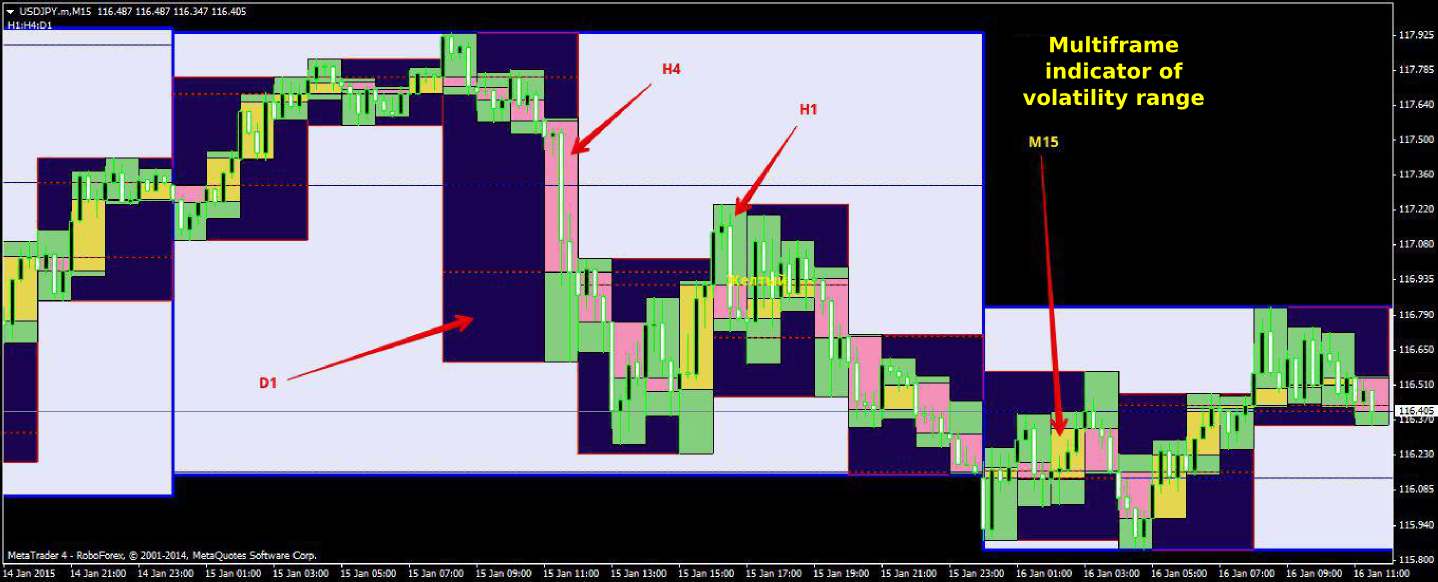
Multiframe indicators to build levels of volatility should be noted separately:
Another example of the graphic indicator is a well-known Alligator, which is presented by separate groups of charts (in one color) for each period.
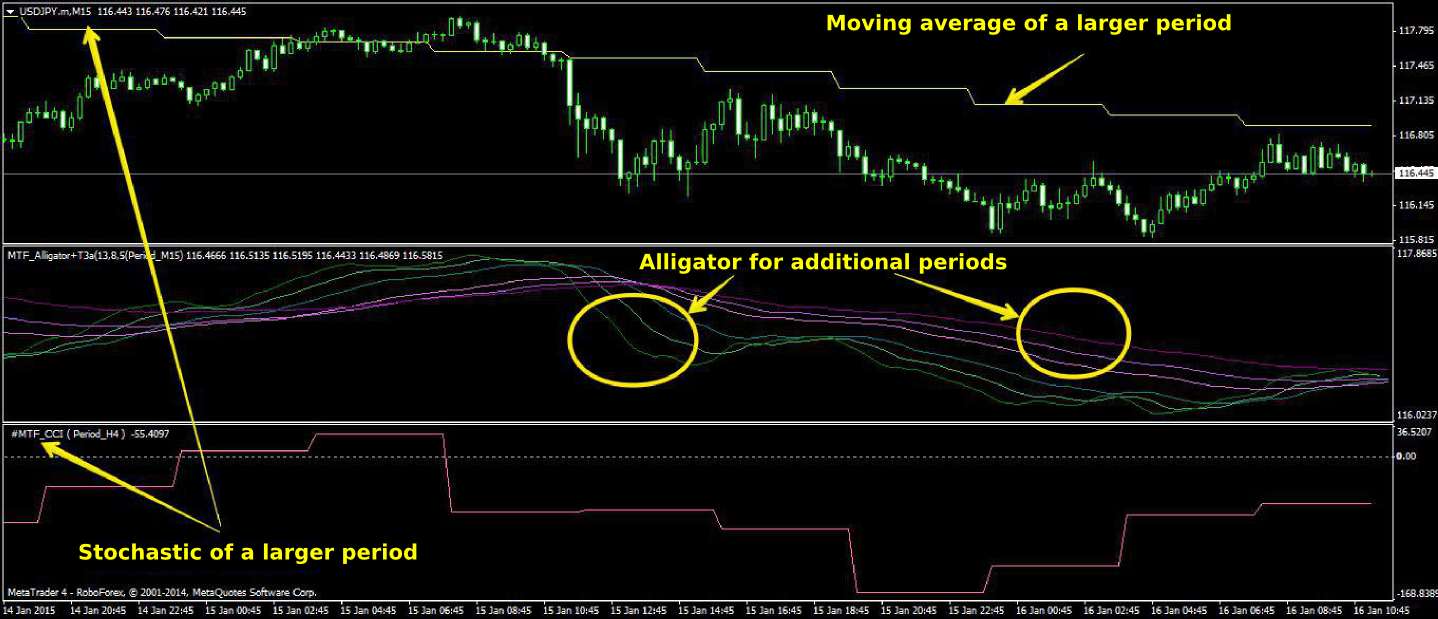
The screenshot above shows the representative of another class of the multiperiod indicators in the second sub-window, Stochastic Oscillator, which is built on the period larger than the current. This version "smoothes" the price surges, but more accurately shows the movement in the extreme overbought/oversold area. There is another common variant of the stochastic, which has the common appearance for the oscillator:
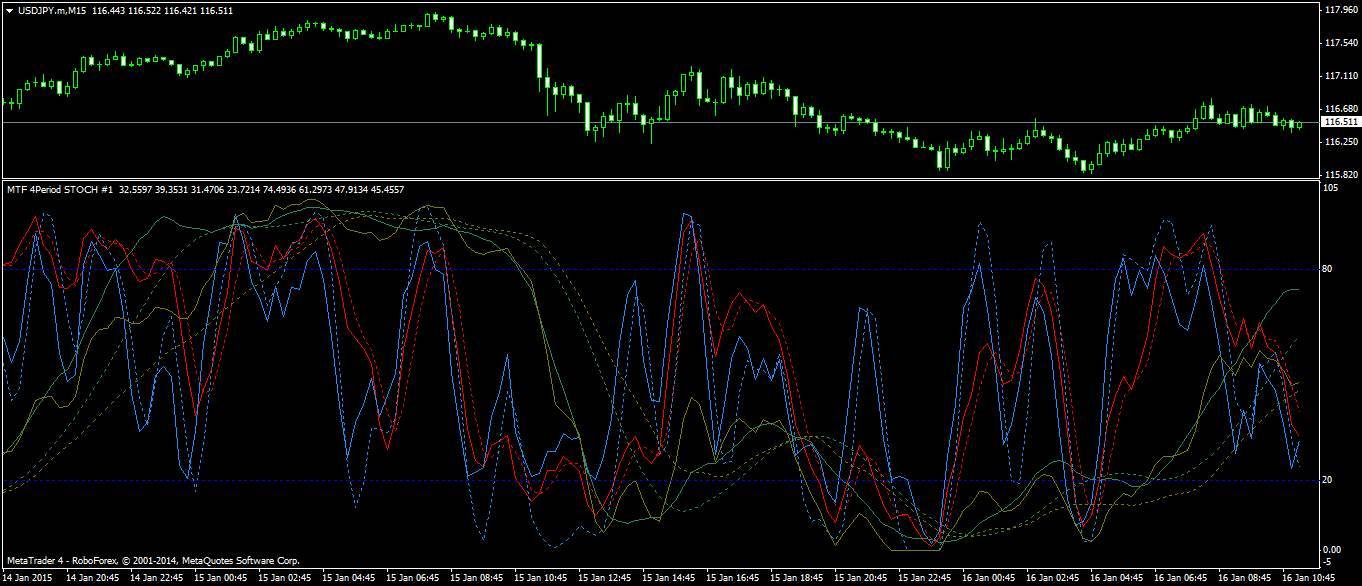
Important: the intersections of several "chart packages" of the same indicator signal about the strong price levels or reversal points.
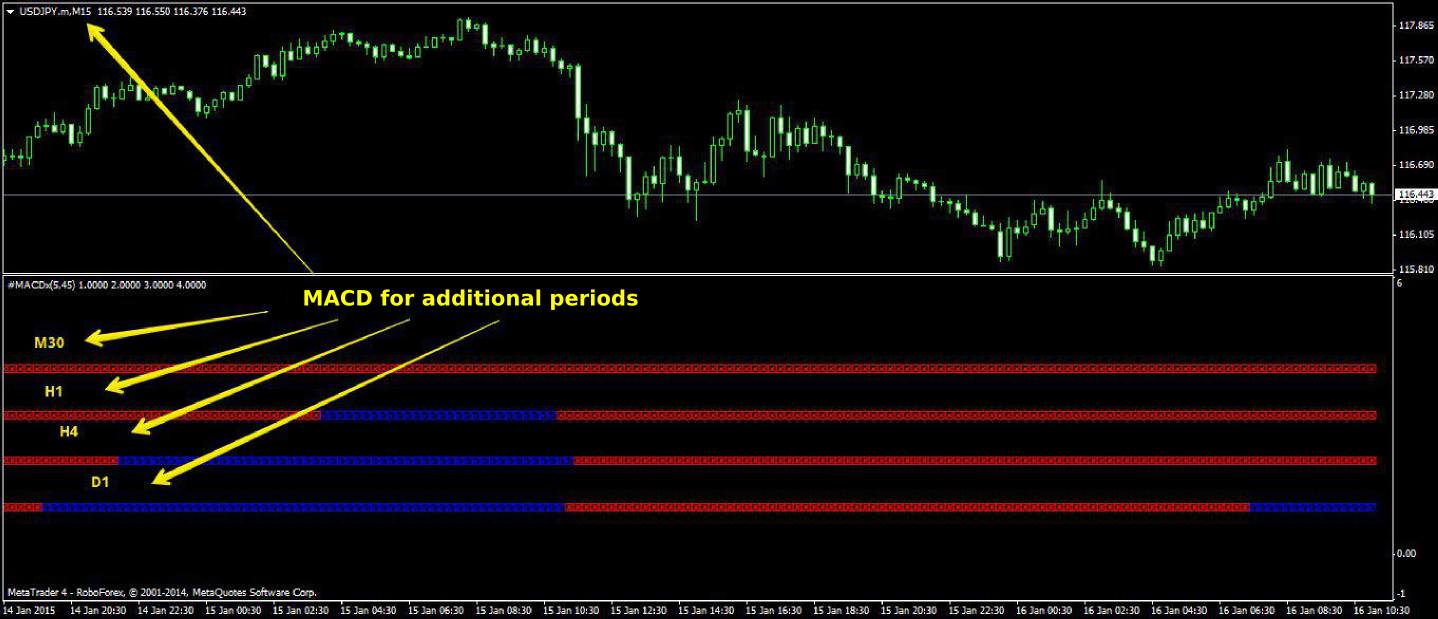
A separate group can be regarded as so-called signal MTF indicators. In order not to overload the working screen with graphic constructions, point (signal) lines or graphic blocks are formed, which reflect the trend or other parameters. That's how the standard MTF_MACD will look like:
or a set of moving averages for several periods:
The use of MTF indicators in trading
Even if multi-indicator gives a signal for entry (e.g., draws an arrow), the accuracy of such signals is uncertain. The use of such indicators is well combined with the classical trend strategies that use data from multiple timeframes, such as "Wolfe Waves" or "Three Elder screens". The main task of such tools is analytical, they just visually optimize the working trading environment.
And as a conclusion...
Efficient use of visual space of the working terminal is necessary for both scalpers and long-term traders. Of course, the use of multiple timeframe MTF indicators is justified within reason – you can’t overload the working screen with the excessive amount of information. But regardless of the chosen trading strategy, the data displayed on one screen increases the accuracy of the analysis, saves time and can ultimately allow to correctly enter the market or close a position on time.
Social button for Joomla