This article will continue to review predictive indicators for Forex market. First of all, we’d like to remind you that it is impossible to know the direction of the market with 100% certainty in advance, so performance evaluation of the algorithm is reduces to the answer to the question of whether the imprecision is acceptable or the indicator redraws the forecast and makes it even more profitable to “trade by a coin”. Let's start with interesting and complex indicators built on mathematical laws.
Predictive indicators, which are based on formulas and laws of the exact sciences, have several advantages: firstly, the laws have justification, supported by the experience of many generations, and secondly, in order to assess deviations and errors, special methods can be applied, developed at the time of the main law creation, rather than general elementary calculations.
Predictive indicators Fourier Extrapolator and a non-linear regression channel
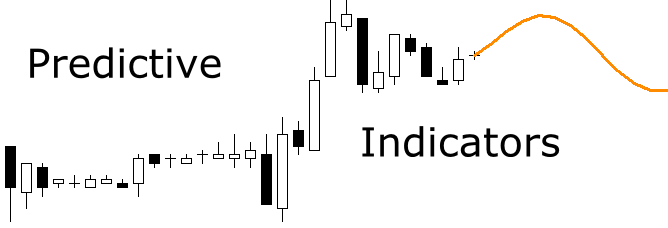
Fourier Extrapolator borrows a number of provisions from the spectral analysis and performs Fourier transformation. It is impractical to go into the physical basis of the terms, so in short words, the algorithm analyzes the amplitude spectra of several periods, reveals the third-order harmonics, extends each of them for one period in the future, and summarizes the results obtained by displaying the result on a graph in the form of one predictive line. The indicator of Fourier extrapolation has the following advantages:
-
it doesn’t redraw its values as the price moves, so there is no uncertainty when taking the decision;
-
allows to evaluate the performance on history: to do so, specify an offset from the current bar through the Shift parameter.
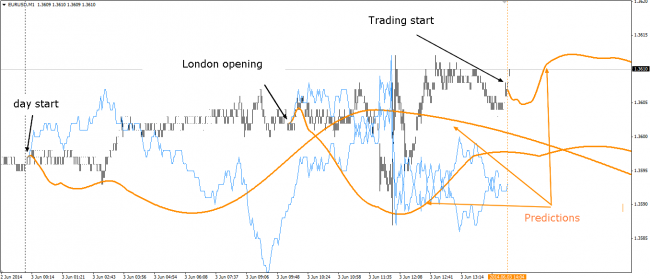
In order to have a complete picture of the situation, it is reasonable to divide the working window into several transformations with different offset periods – for example, since the beginning of the day, beginning of the work session, and the start of trading. In the first and second cases, we obtain the overall forecast for the day, in the latter – an approximation for the entry points and filter of dangerous situations. The example can be seen in the figure below:
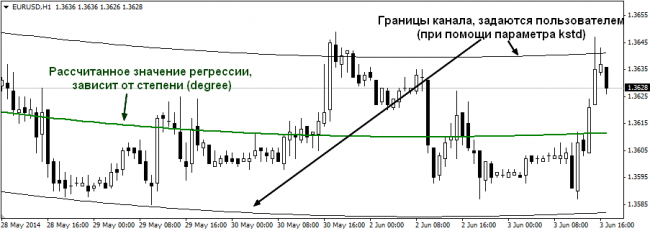
It can be noted that the overall forecast was defined correctly; deviations do exist, but they become unallowable after a few hours, so this indicator is a good helper to define the range of price fluctuations within the day. It is better to identify the trend using non-linear regression channel, the center line of which is built using regression calculations. The chart below shows an example:
The parameter «degree» is used to set the degree of regression, and if you set a value equal to one, we obtain a linear regression channel, which is present in the standard set of the terminal, but will update on its own when the price moves.
Some may call this phenomenon a redrawing, but in order to follow a hot scent of the market, such predictive indicators should discard old irrelevant data and add fresh ones into the system, otherwise the formula will consider the quotes that nobody needs. An important feature of high-order regression is the ability to anticipate a reversal, i.e. a central line is bent against the trend short before the actual price reversal.
Predictive indicators that are not recommended to use
During the review of requests and beginners’ discussions, we ran into the popular indicator Future Candles Pro, also known as "Vanga". In fact, it is a classic mirror tool, no different from the XprofuterOverlay, which was reviewed in one of the earlier publications. Thus, we don’t recommend wasting time on studying it.
Another predictive indicator is Sultonov tool. It should be noted that the author was very responsible when creating it, as he is a Forex manager himself and works with his indicator, but he did some extra work, because the quality of the signals of this algorithm doesn’t exceed earlier regression models, but it inherits all the drawbacks.
In addition, it has no ambiguity in interpretation of the signals, it often redraws immediately, particularly in intra-day trading. In result, you should seek for confirmation by other methods. Given this shortcoming, we recommend a beginner who decided to choose the thorny mathematical way to use a non-linear regression channel, which changes gradually over time as new data appears in the system.
Social button for Joomla


