

")
Medium-term strategies are considered to be the most stable and simple, but many experts teach beginners to give preference to levels and volumetric analysis, and for some reason ignore time-tested reliable indicators.
So, how the indicator may be more effective than these methods? This question is often asked not just by beginners, but also by seemingly experienced speculators. In fact, the answer is very simple: first, the formula is devoid of the ability to assign a subjective assessment of the situation, so it’s never wrong and does not distort the result under the influence of emotions.
Secondly, the algorithm works equally on all timeframes, i.e. only the mere appearance of a new candle is important to it. If you work through the levels, and even more so in terms of volume, candles from different timeframes are unequal, which greatly complicates the optimization of strategies for different periods.
You also should not forget about versatility that all reliable indicators have – it is no secret that the structure of the foreign exchange market and the behavior of participants on it is radically different from the stock market (from where many popular strategies for Forex have been transferred), but the indicator does not care what data series to analyze.
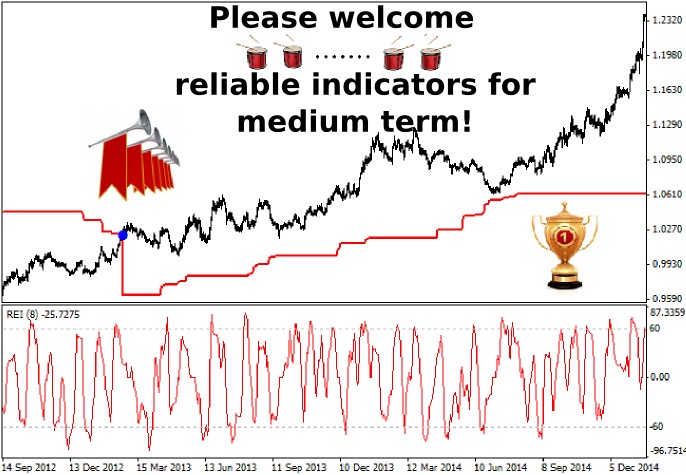
Reliable trend indicators for medium terms
Correct identification of the trend is half the battle when creating a trading strategy. Currently there are hundreds of different algorithms designed for this task, but all of them can be divided into three basic groups, for each of which we’ll consider one expert.
So, the first group includes moving averages. Perhaps these are the most reliable indicators, because average values over the period are considered objective criteria and are used not only in Forex, but also in many other areas – for example, to draw up a variety of corporate and government budgets.
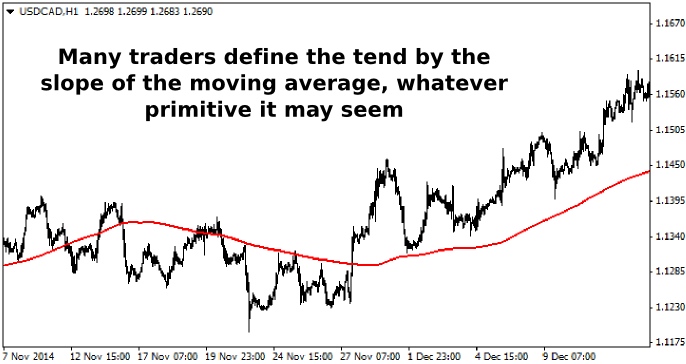
Most often, traders work with simple and exponential moving averages, but now there are dozens of different modifications and combinations, some of which have already been reviewed on our portal in the "Forex indicators" section.
The next group of trend indicators is not as extensive, but its algorithms show better results in comparison with the usual MA. These reliable indicators are based on High and Low of the market for the selected period, i.e. at any time, the user can observe one of two situations on the chart:
- If the current price is above the Low, the trend is upward, so only the buys are relevant;
- If the price is below the High, trend is downward, and therefore only sells are relevant.
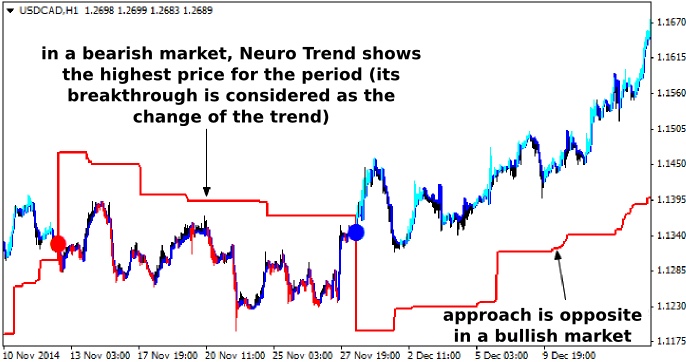
The figure above shows an example of such a markup from the Neuro Trend Line indicator (also known as the Perfect Trend Lines). This is one of the latest versions of the expert, in which the developers made it possible to adjust the shift of the lines along the vertical axis (useful function on instruments with a lot of "noise").
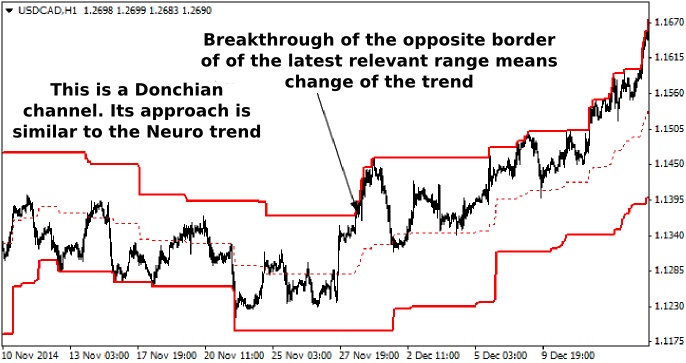
Donchian channel works by a similar approach, but it is more difficult to watch out for the borders of the channel than for a single line, so many traders take into account only the direction of the central line. The only advantage of the "Donchian" against the Neuro Trend is the ability to specify a shift of markup along the horizontal axis.
Reliable indicators of the trend from the last group of trend algorithms process prices with special formulas and build new (modified) candles. The most famous example in this case is Heiken Ashi, which is known to almost every trader.
But one thing is to try to use this method as a signal generator – they say, to open a long position when a bullish candle appears and work in shorts with the appearance of a bearish – and quite another is to identify a trend with it. You will have to combine multiple timeframes for this task:
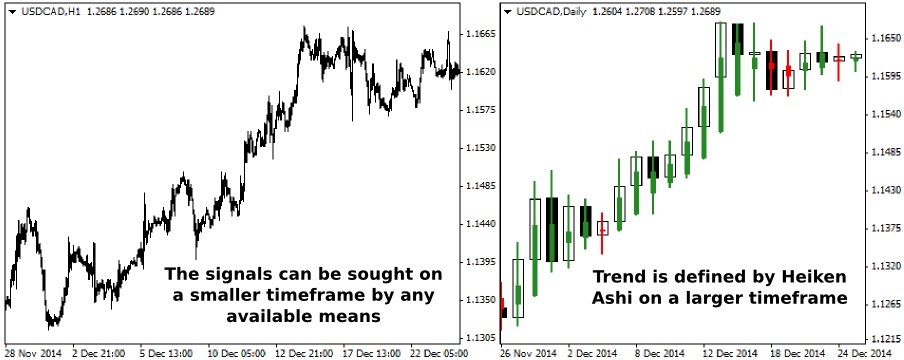
To be honest, we almost never met such strategies because the attention of the speculators is paid to either Heiken Ashi patterns or the color of these candles, so if you use these simple tips, you can gain a competitive advantage.
Reliable indicators to search for signals
In previous publications we have repeatedly considered such indicators, ranging from classical oscillators built in MetaTrader and ending with non-standard algorithms that borrow positions of the cyclical and even regression analysis.
All of them can be used as a signal module, so you are strongly advised to familiarize yourself with the materials, and today (not to be repeated) we’ll add another algorithm called Range Expansion Index to this collection, shown in the chart as follows:
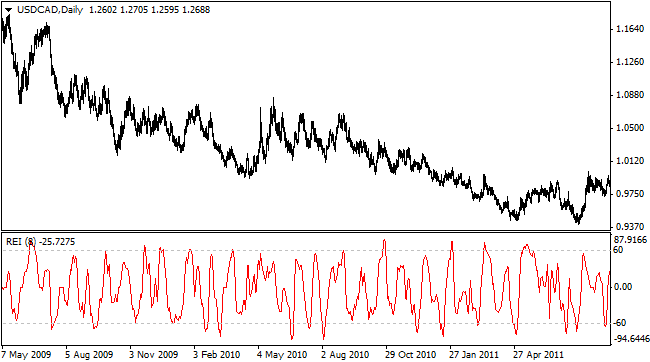
In spite of its "advanced age”, REI is rarely used – most likely, such a low popularity is due to the reluctance of many traders to study the literature, because Thomas DeMark described it in detail in his book "New Science of Technical Analysis".
Like all reliable indicators, REI is built on simple formulas and therefore does not require any additional knowledge in the field of mathematics from the trader. DeMark himself called his development a relative oscillator, since its main purpose is to measure the rate of movement of the price and notify the trader about the market reaching overbought/oversold state.
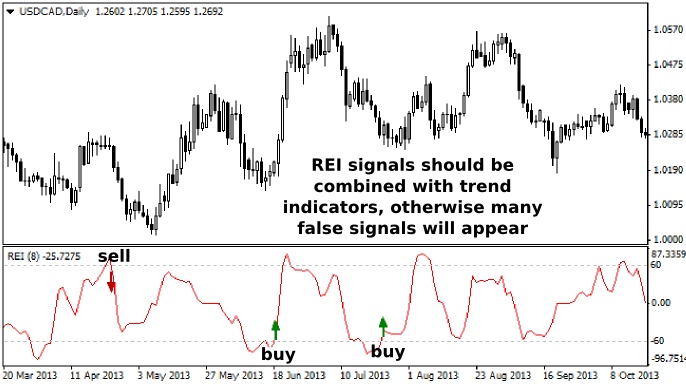
The principle of operation of the indicator most likely no longer causes any problems, but just in case, we’ll explain: if the indicator line entered oversold area and returns to the "normal" range, we open the deal to buy; if the indicator entered the oversold area and returned – sell.
But closing of the position is not so simple – experience has shown that the indicator often fails to reach the opposite border, and the market is already beginning to reverse, resulting in once the profitable deal closing by stop-loss. To avoid such situations, we do not recommend to be guided by the REI readings for the exit – instead, it is better to rely on a fixed take-profit, calculated based on the average volatility of the pair for the last 20 days (working month).
As for the settings of the algorithm, here everything is very simple – the user can only change the calculation period. Of course, it is better to be safe and increase the range analyzed in small timeframes, and you can leave the default setting (Period = 8) on the daily charts.
What are characteristics of the reliable indicators
As a small conclusion, we’ll just recall two important features that are typical of useful algorithms: the first thing you should pay attention at once is that all effective indicators do not repaint on the history (exception is the repainting of the last candle before its closure).
The second feature is associated with the versatility, i.e. reliable indicators work on any asset. If the author argues that the formula is suitable only for a EUR/USD pair, for example, it is a sure sign of the usual "fit" of the parameters for volatility, and where is a guarantee that for the same European currency, the oscillation amplitude won’t change in a year?
Social button for Joomla