
In modern trading realities, there are quite a lot of various tools to predict market trends. Despite the fact that the determining factor in trading is money management, most of the players are constantly in search of the tools that can greatly simplify the trading process. In this article, we will focus on a whole class of analytic scripts. They are predictive indicators.
What are predictive indicators?
People have long tried to look into the future. And trading is no exception. It so happened that basically all the books and theories of trading in the financial markets are based primarily on the accuracy of forecasts. They tried to anticipate market trends back in the earliest epochs of trading. First there were candlesticks, which have now become a classic graphical technical analysis. Then, the so-called Elliot Wave Theory became no less popular. Today, attempts to predict what can happen tomorrow never stop.
Demand for these forecasts creates supply. At the moment, there are many specific indicators that are able to generate the most probable scenarios of market dynamics. All of these tools can be combined into one class – predictive indicators. Among them, there are both the ones most interesting and worthy of attention, and entirely useless products with prohibitively low percentage of hits.
Currently, there are even some communities of traders who are good in programming and create products aimed at general consumers. Among many such projects, there are also nonprofit resources where you can get information and download the indicators you liked. Below we’ll review the most popular predictive indicators.
DailyPivotPoints indicator
The fairly well-known indicator, DailyPivotPoints (DPP), opens our short list. Almost every trader, who studies predictive indicators, is familiar with this name, which almost completely reflects the way of its operation. DPP generates certain so-called anchor points, which the trader can consider in making trading decisions. To calculate these points (levels), the data is used on the dynamics of the price over the previous trading day.
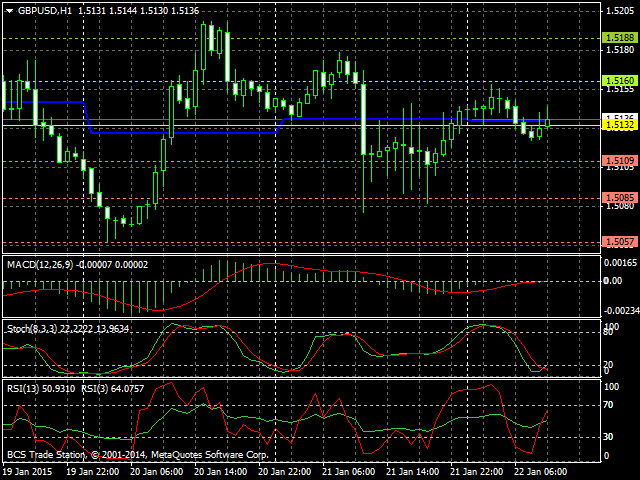
The result of all calculations is the levels: magnetic point, support and resistance lines, as well as the equilibrium point. All lines are formed directly on the chart of the traded instrument. Yellow levels are located above the expected (magnetic) price, and the red ones are below.
Thus, DPP is quite an interesting indicator that not only helps traders determine some specific points, which the price is more likely to reach, but also sets the levels at which the price may face resistance or get stuck. DPP can be used by both the traders along the trend and traders specializing in trading within the range.
FuturoFX indicator
An indicator of coincidences, FuturoFX (FFX), is next on our list. By analyzing historical data, FFX searches for matches in the trajectories of the price movement. In fact, all the work is based on an approximation of the dynamics of prices for a certain period. The increment is specified in the indicator settings. The result of the calculations is simulation of the chart signs. This is a channel, which is based on the average of similar historical data.
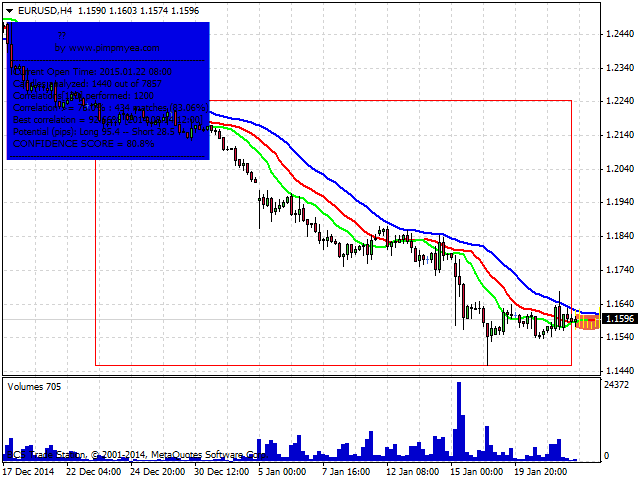
The permissible level of accuracy is 25%. Therefore, a necessary and a sufficient degree of similarity is a coincidence of 75%. There are no restrictions on the timeframes for the indicator. That is to say, the FFX can be equally well applied to both H1 and W1 frames. The most similar match is copied as a set of yellow bars, as if continuing the current chart.
Xprofuter indicator
Continuing our informal top list, we will also review the well-known predictive indicator named Xprofuter. This tool works well mainly in the framework of the trend. In the consolidation phase, the predictive value of the indicator tends to zero. Xprofuter builds a line on the chart, continuing it. The probability that a simulated trajectory of the indicator will coincide with the future price is about 70%.
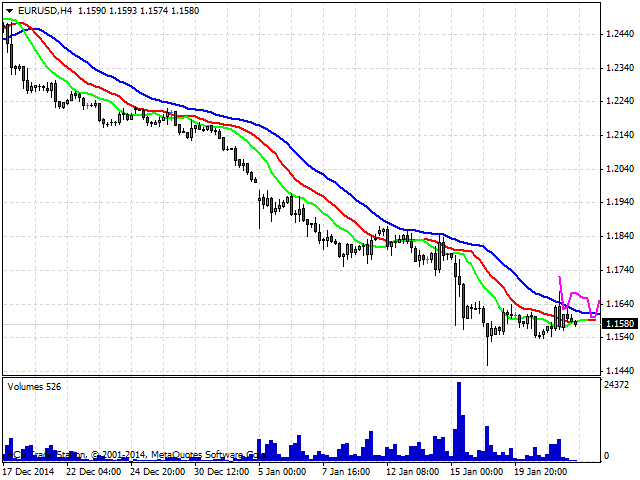
This is a very respectable figure for trading. The downside of this tool, perhaps, is the fact that it is able to provide more or less stable results only on small timeframes. Although, it is worth noting that most of the predictive indicators work most efficiently at a relatively small time periods.
TSF indicator
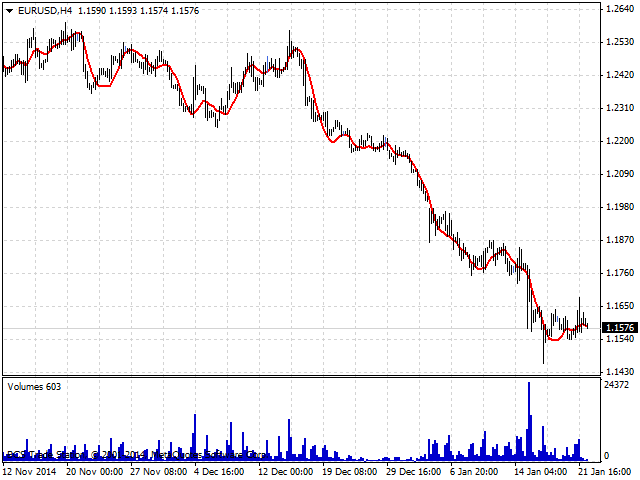
Time Series Forecast (TSF) completes our list of indicators. You should not underestimate the high degree of sensitivity of this indicator. TSF in the chart is displayed as a line, which is superimposed on the trajectory of the price change. It is quite easy to use this tool. If the quotations of the currency pair go below the TSF, this fact indicates a high probability of a downward trend, and vice versa.
Summary
At the end of this article we would like to give you some recommendations. All of the above indicators should be thoroughly tested in demo mode or get some optimizations before the direct use on real trading accounts. It is not recommended to use only one indicator, since it is likely to get into a trap of failed transactions. Predictive indicators, despite their promising title, are far from a guarantee of profitable trading. But they are definitely worth using as auxiliary tools. This is the real mathematical creativity, if we can say so. The search for optimal strategies, the choice of tactics and money management tools for trading. All good things come to he who waits...
Trade safe!
Social button for Joomla


