

")
Indicator QQE belongs to a class of rare algorithms that consistently work on any trading tools for decades. It’s not hard to guess that QQE is the abbreviation, and the full name of the expert is Qualitative Quantitative Estimation.
We have knowingly focused on the time horizon: the matter is that the first version of this indicator was written in 2008 (based on open sources), i.e. before the height of the global financial crisis. Over the next five years, when the foreign exchange market volatility has increased, many trading strategies stopped working – but not the QQE indicator. Thus, the algorithm has passed stress test successfully.
It becomes clear from the full name that this algorithm was designed to provide a quantitative and qualitative assessment of the movement, but to be honest, in the process of testing, we have not been able to make out a quantitative estimate – it seems that the author meant a range of variation in the indicator within the upper and lower extreme boundaries, but there was no problem with a qualitative assessment.
QQE indicator: general theory
If we look at the following chart, we can immediately see the similarities between today's "experimental" and the classic RSI. The fact is that QQE indicator is based on the relative strength index, but uses a smoothing technique as an additional transformation.
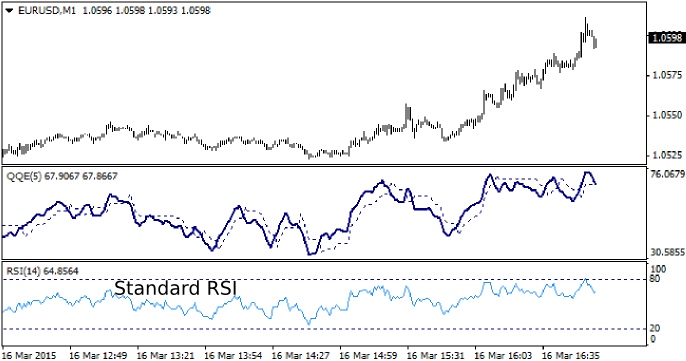
You will need to set only one parameter – “SF”, an analogue of the period in RSI. By the way, judging from the open source information, the algorithm used the standard strength index with a period of 14 for calculations. The author also left the possibility to adjust color of the lines. Qualitative Quantitative Estimation can be used in two directions:
- determine the trend, i.e. if the line is above the 50 level, the trend is ascending, if below - descending;
- search for signals at the moment of crossing of the main (bold) and signal (dashed) lines. Let’s consider the second option in the examples:
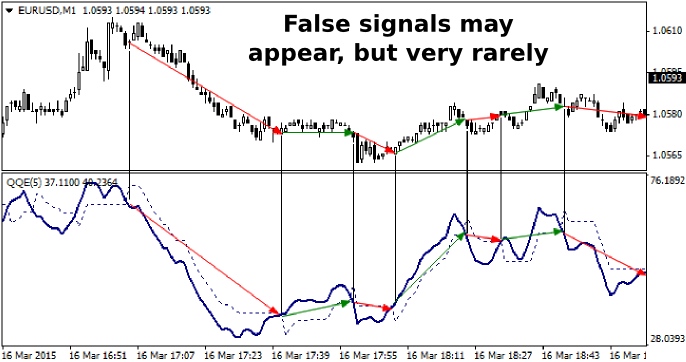
The QQE indicator rarely generates false alarms and has virtually no lag, which makes it invulnerable both during periods of increased volatility and during flats with wide amplitude. Larger timeframes deserve special attention, as you can catch a very strong movement. As an example, let’s consider one of the trend trading instruments – futures on the S&P500, CFD for which is open for trading in virtually any dealing center:
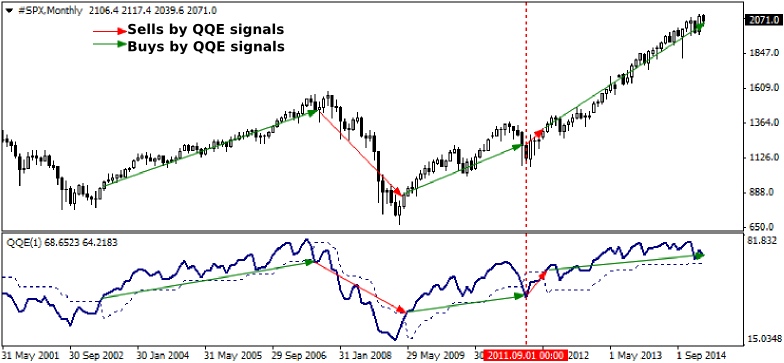
The indicator under consideration could help work along the trend over the past 14 years – the only area where the equity dynamics was negative started in September 2011 and lasted only five months. The operating principle is no different on currency pairs. By the way, you can reduce the number of false signals on a monthly chart by setting SF = 1: in this case, the indicator will react faster.
Another detail that is required to be taken into account is the following: it is permitted to open a position only after the closure of the signal candle; if the indicator lines intersect but the candle is not closed, it is likely that the market situation changes dramatically over the remaining time before the period expiration, and the whole layout will be redrawn.
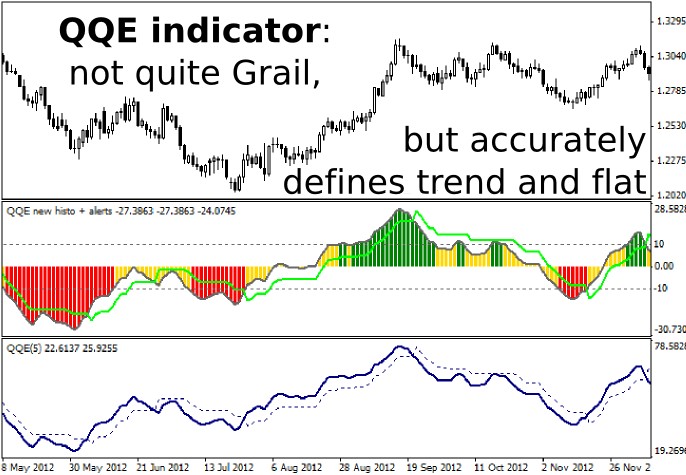
QQE New Histo Indicator: improved version
As you know, any working method is undergoing a lot of changes (the paradox of the modern market is that traders are always trying to improve something that works just fine), and the indicator considered today is no exception. We will not list all of his "modes" and additions – instead we’ll focus on one of its most recent and highly successful versions.
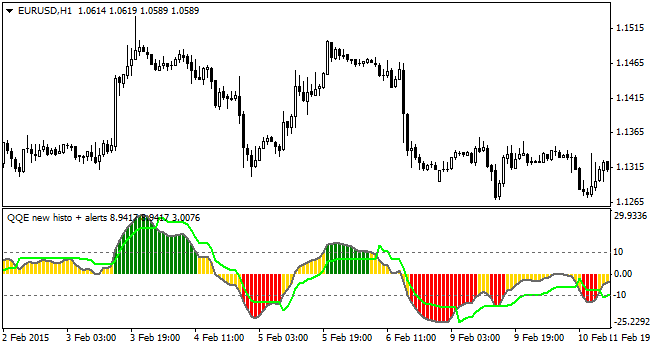
Indicator QQE New Histo is represented as a color histogram and does not differ from the basic version (if you use the default settings). However, the developer still changed the scale – now the central horizontal level close to a struggle is not 50 but zero, but these changes have no effect on the result, they just make it more convenient to analyze the situation.
And now about the most interesting: in the first place, New Histo gets an opportunity to specify the RSI period (now it can be anything, not strictly 14), so the user can directly influence the reaction rate of the indicator, and secondly, you can set two horizontal levels in the settings, the intersection of which by the main line leads to a change in the color of the histogram:
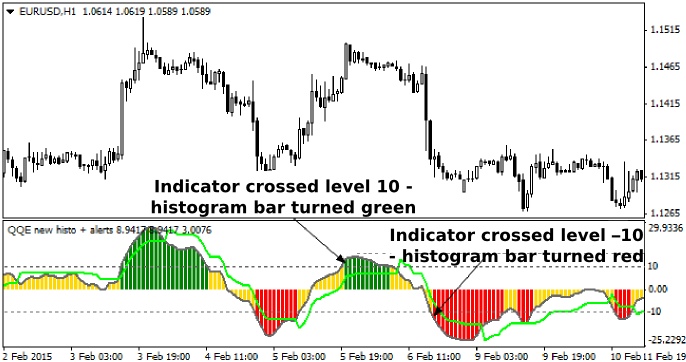
Here it should be noted that the author complicated the formula, because UpperBound and LowerBound variables correspond to these levels in the settings window, but they are not equal. The matter is that the indicator performs an additional action to calculate signal levels, e.g., if UpperBound = 60 and LowerBound = 40, the role of signal levels would be played by the following values: 60–50 = 10 for the upper level and 40–50 = –10 for the bottom.
The third bonus of the new version is the ability to customize alerts using the unit of the specific settings. From the variable names it becomes clear that the notifications can be enabled using AlertsOn by setting the field to true – as for the other parameters, they are as follows:
- alertsSignalLineCross – signal at the intersection of the lines;
- alertsOnCurrent – signal appears at the intersection of indicator lines and zero level;
- alertsMessage – display a message about the signals;
- alertsSound – turn the sound on;
- alertsEmail – allow notifications to the mailbox (if the terminal is configured).
QQE New Histo Indicator as an element of a trading strategy
Actually, there is nothing new in this direction: again, the main advantage of the indicator considered today is quick response and accurate signals, in all other regards it is used in the same way as all other similar oscillators (e.g., CCI). But for beginning speculators, we’ll review scenarios in more detail.
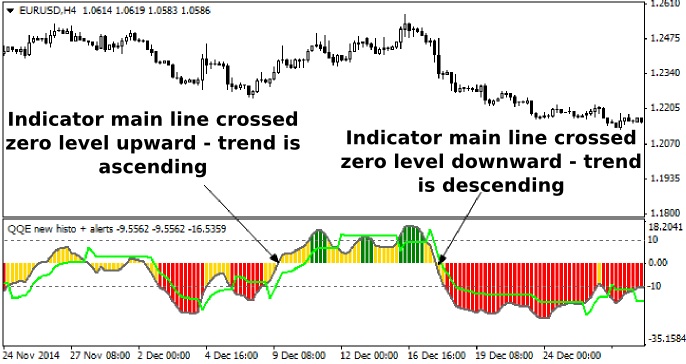
So, the first strategy is to use a histogram indicator QQE as an identifier of the trend. In this case, we are interested only in the intersection of the main line by zero level. Perhaps, this is the most reliable approach on the major timeframes, which we mentioned in the study of the classical version.
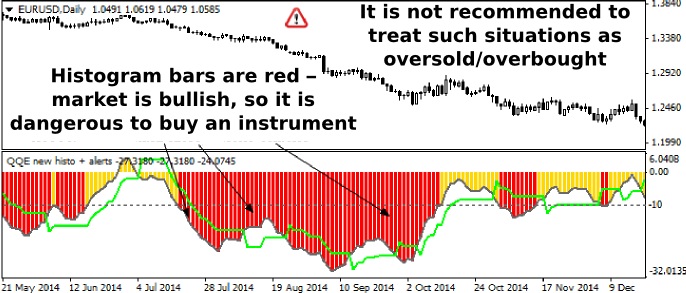
The second strategy is to consider the yellow areas as flat – thus, bullish trend in this case will be green, and the period of the bears’ strength will be colored red. Please note that if the bar changes color, it's not a signal to buy/sell, but only a notice that one side has gained an advantage. This means that specific entry points should be found using other methods.
Summarizing, we should note that the indicator QQE does not raise any problems, it can be useful for both the beginners who just set foot on the way to learn trading and experienced traders as an additional method or as a signal module. In addition, programmers can try to create an expert on the basis of its code – this idea seems very promising.
Social button for Joomla