

")
ROC indicator measures the rate of change in price and is used in many strategies, both as a trend identifier and as a signal indicator. There are several variants of this indicator, the first one measures the absolute difference between the closing prices of the first and the last candle in the period; the second is more popular and will be discussed below – it calculates the relative change in price.
Thanks to its simple formula, the ROC indicator can be used with all tools and timeframes. Besides, only one parameter needs optimization during the setup – Period, which is also the only one.
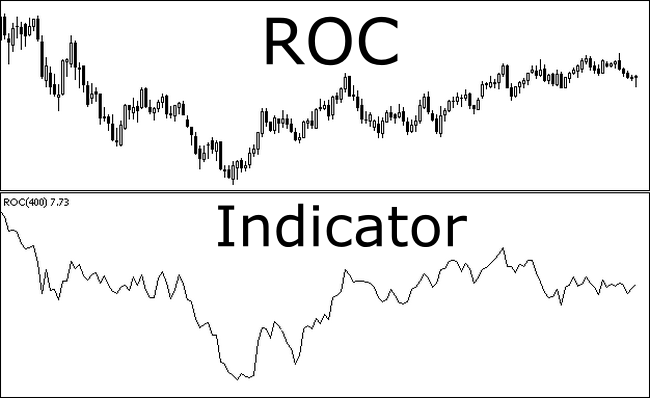
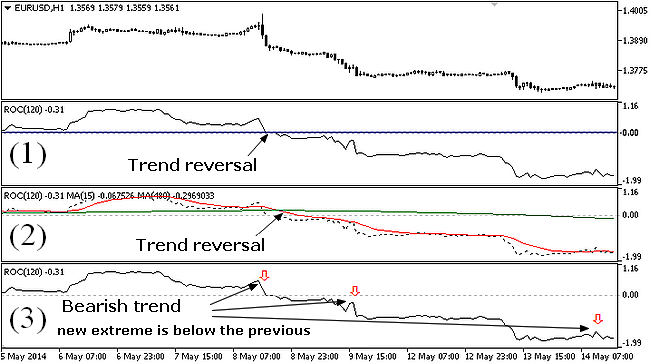
Rate of change in price demonstrates the prevailing mood in the market – in particular, if the indicator line descends, it means that the market is bearish, if it ascends – the market is bullish. So, if you set an extended period of calculation, you will get the trendline. The figure below shows an example of the working window, where the market behavior can be treated in several ways:
-
with the zero level (1). ROC readings below zero indicate a bearish trend, above zero – a bullish trend. This interpretation is primitive, but surprisingly efficient;
-
the trend is defined at the intersection of the fast and slow moving averages (2), calculated on the basis of the main indicator. This approach eliminates the noise and gives leading signals in some situations;
-
approach for experienced traders (3) – a visual interpretation of the sequence of extremes.
ROC indicator and signals for opening orders
We have discussed the ways to identify a trend, which is useless without definitive entry points. The ROC indicator copes with this task as well. Given the fact that this is a classic oscillator, the signals are generated from the extreme boundaries, which are determined experimentally.
To receive acceptable quality and frequency of the signals, you should select parameters considering the volatility of the pair, the optimal period is 12 for an “hour” – correspondingly, you can get more frequent entries if you reduce the value, but you’ll also lose in quality. The chart below shows a few options to see the difference: in this case, signals to sell are relevant.

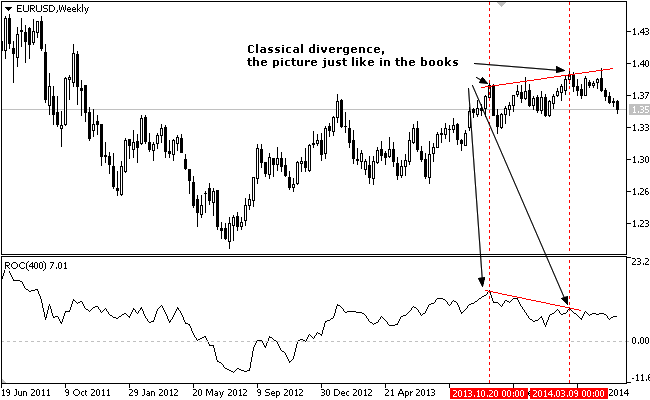
The ROC indicator is often used in countertrend strategies based on divergence. It should be noted that in comparison with using MACD, the signals are much more accurate, since the formula itself is more objective than the convergence-divergence of the “movings”. Nevertheless, it is not recommended for beginners to trade against the trend, but if you want to test such systems, you must look for signals on the daily charts and older. For example, a bearish divergence on the week timeframe of the EUR/USD pair is shown below:
In summary, we would like to emphasize the strengths of this indicator. First of all, it is very easy to set up and read; secondly, it can determine the dominant force in the market by several ways; thirdly, it gives qualitative signals for both position trading and working within the day.
Social button for Joomla