

")
Trading along the trend will always be the most reliable and profitable on any financial instrument. Searches for reliable trend signals led to the creation of the SuperTrend indicator – it allows you to properly "see" the mainstream, open the deal in time and work it out along the trend with maximum profit.
Looking for the perfect tool that would be accurate enough and would not overload the chart with unnecessary information, traders have begun to develop so-called hybrid indicators that combine the advantages of trend ones with the precision of the oscillators.
A typical representative of this family, the SuperTrend indicator is in high demand both for manual use and in automatic trading systems that follow the trend. It is simple to use, requires no complicated setup, locates directly on the chart and uses an intuitive color display.
Mathematics of the indicator
Mathematically, the proposed indicator is based on two popular technical analysis tools for Metatrader: ATR (Average True Range) with a period of 5 and CCI (Commodity Channel Index) with a period of 50.
On an uptrend CC(50)>0: the values of the SuperTrend indicator are defined as the sum of: (ATR value)+(The high of last closed period).
In a falling market CC(50)<0, the value gives the difference: (the low of the last closed period)-(ATR value). The result is the indicator reading.
Important: there are options for indicators with different parameters of CCI and ATR that are a part of the indicator, testing prior to using them is a must!
Installation and setup
The indicator is adjusted by the usual method for MetaTrader: the indicator file is placed to the directory «Indicators», then transferred from the control panel to the price chart. There are only two parameters: the timeframe and the colors.
Usually a pair of indicators is used – fast and slow (multiframe):
Multiframe version of the SuperTrend indicator should be mentioned separately. It differs from the ordinary one by the fact that it performs calculations on several time periods, that is, several indicators can be applied to one price chart and you would see the general trend in detail – from the small to the larger period.
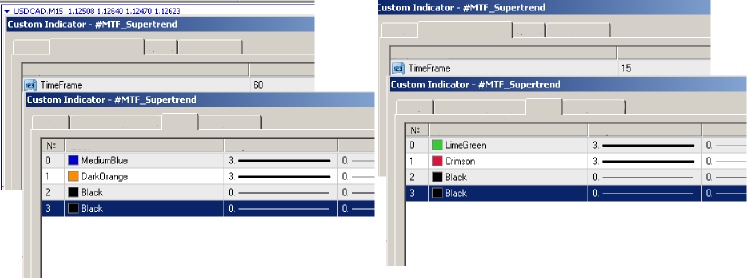
The Timeframe parameter for such indicators is specified in minutes according to the table:
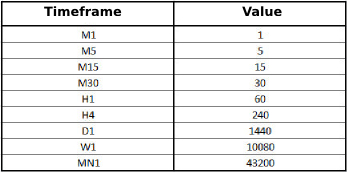
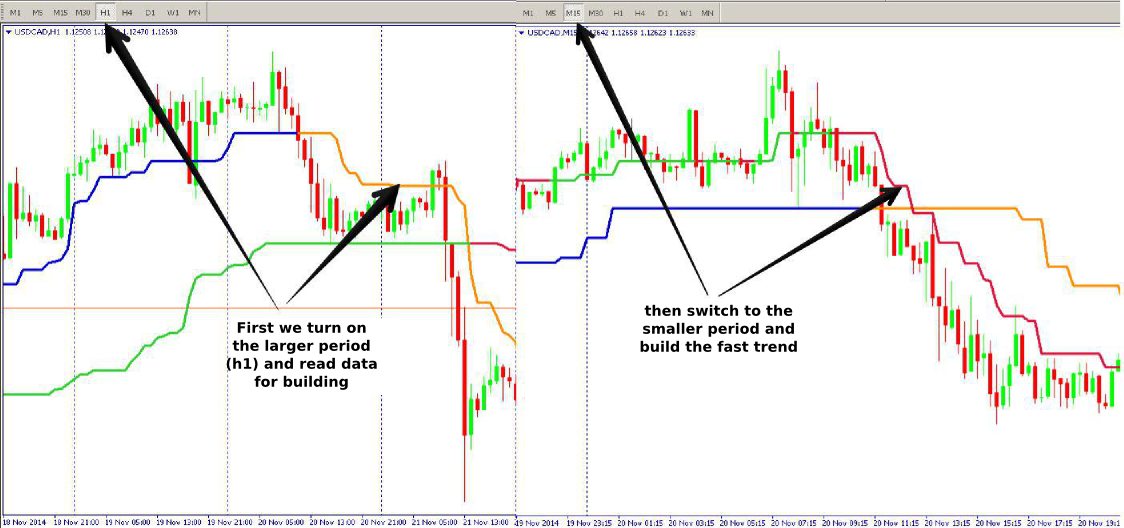
Important: If you are configuring a pair of SuperTrend indicators, you must first switch to a longer period in order to read the data for building, and then return to the smaller one. The chart of the longer period in the meanwhile remains (doesn’t redraw).
Application of the SuperTrend indicator in trading
Actually, CCI(50)0 component is responsible for the trend direction, and key levels are calculated by ATR(5), i.e. CCI indicates the status of the trend (its existence, the beginning or the end), and the sensible ATR generates points to open the positions.
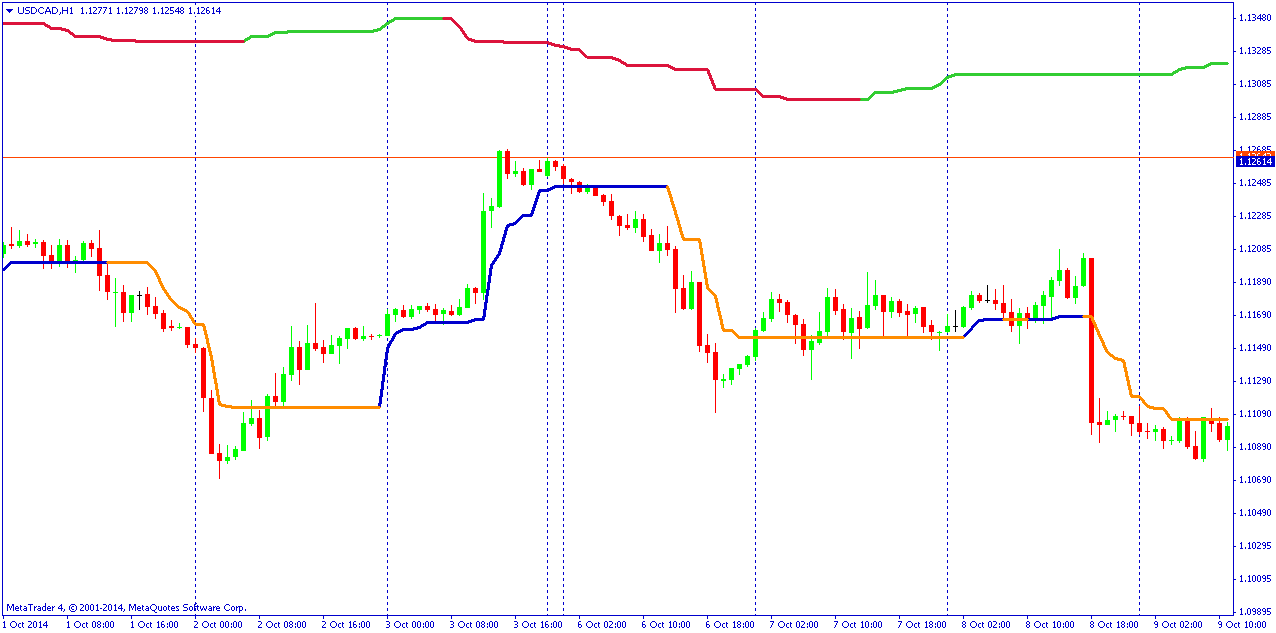
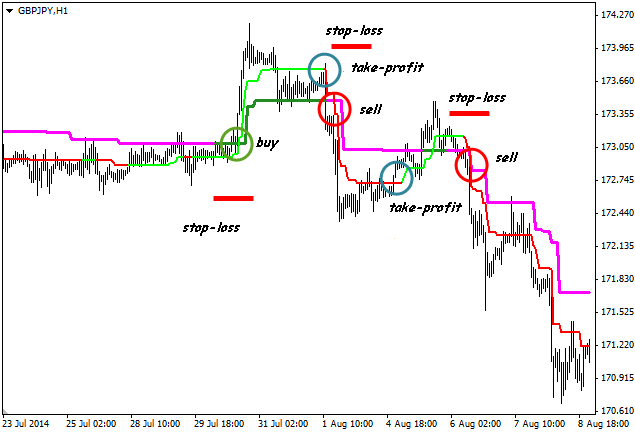
When trading on the indicator: the buy signal is the point where the signal line changes color from red to green (or any other, indicating an upward trend), the sell signal is the change of the line color to red (the traditional for the falling market).
If the signal line is green and growing, the upward trend is strong, but if it has horizontal sections, and the color does not change, the growing trend is preserved thus far, but fades away.
Similarly we judge for a falling market – if there is a change of color and the value of the indicator decreases, the trend is bearish, which weakens at the formation of horizontal sections.
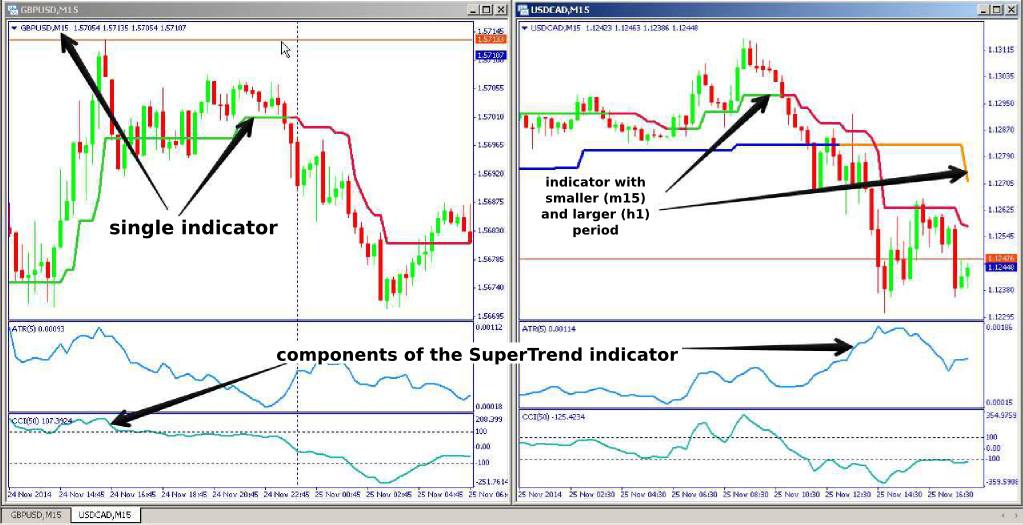
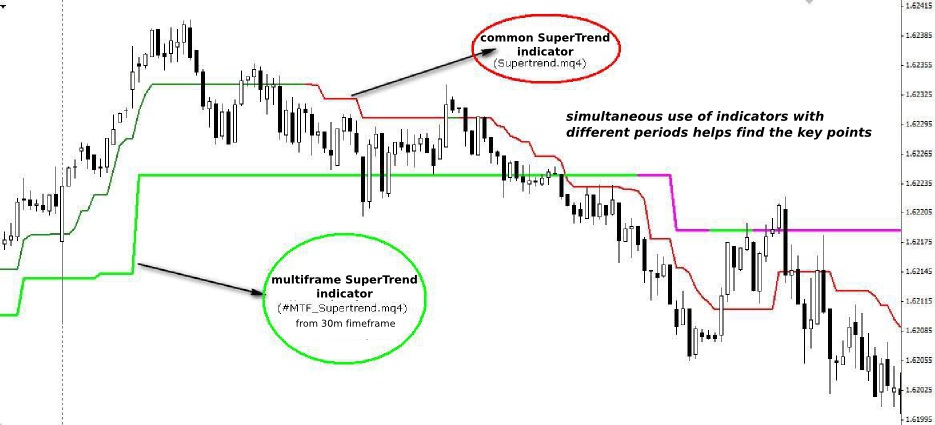
The approximate scheme for a pair of indicators is shown below:
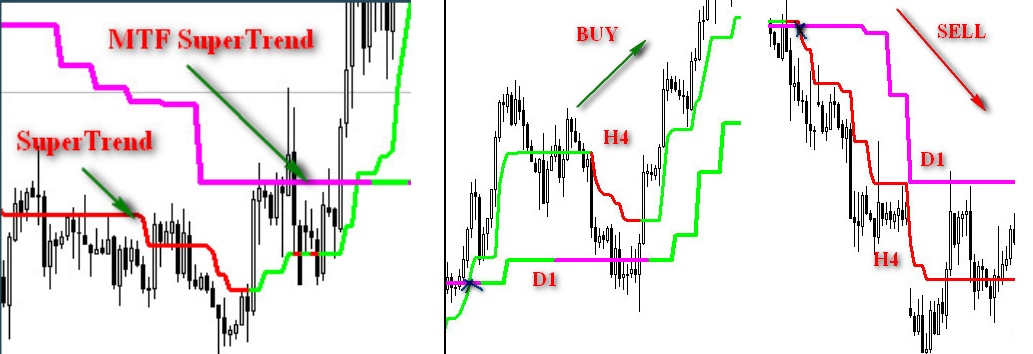
Simultaneous use of SuperTrend indicators with different periods helps to find a reliable entry point.
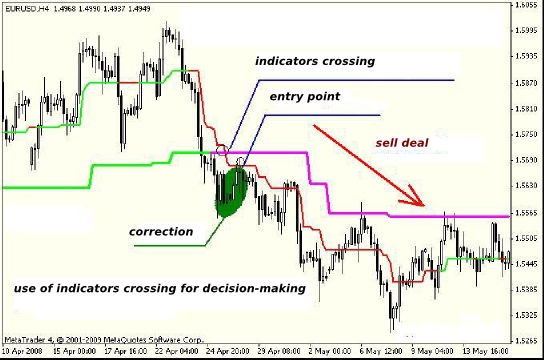
If the indicator with a smaller period moves above a larger (older) indicator, the market is considered to be bearish, but at the moment of crossing the larger by the smaller upwards, the trend changes to bullish.
If the indicator color has changed, but there is no intersection, then this situation can be interpreted as a correction or a flat period.
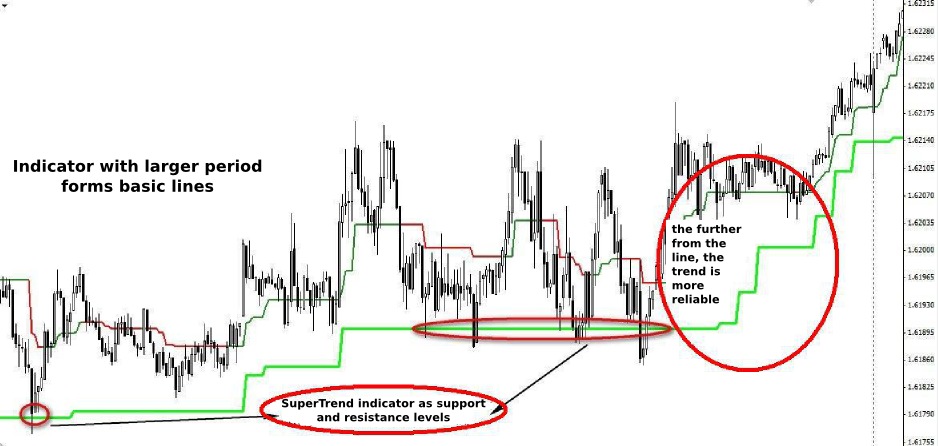
At the same time, you can use the horizontal sections of the indicator with a long period as local support/resistance lines and trade on the rebound from them. The indicator of the larger period shows the global direction, and the greater the distance from the price up to this line, the stronger the trend and the longer this trend will continue. At the possible change of the trend, the lines of small and large period start to descend.
Another method of trading with this indicator can be considered as entry into the market after a brief correction, if there is the fact of the color change. If, for example, the color changed from red to green, then wait for the first downward correction and open the buy at it. You need a fact of the color change from green to red to sell: we are waiting for the first correction upwards and open the sell.
The approximate scheme of arranging the stop-loss + take-profit bundle:
First of all, the use of the indicator is recommended for trend trading, i.e.:
- as a filter of the direction of the open transaction (red – sell, green – buy);
- as the main signal instrument (with a change of color of the signal line – from green to red to sell, from red to green to buy)
- as a tool to identify the general trend from small to large periods using the pair of indicators;
- as an indicator of price levels and lines of support/resistance.
And as a conclusion...
Any speculative movement that breaks the market trend sharply reduces the profitability of its signals. In addition, when using only the trend indicators, it is difficult to estimate the volume of transactions and, therefore, forecast of the trend movement in the short term may be inaccurate.
Important: Separate use of SuperTrend indicator without combinations with other types of indicators, as well as periods below M15, is not recommended!
At the same time, it can be considered the best indicator to determine the direction of the trend: its multiframe variations provide excellent visual perception of the overall market picture. Due to the fact that it is built on standard basic indicators with a transparent method of calculation, it can be used on all types of instruments: stocks, currencies, futures. The indicator can be successfully integrated into a set for any medium-term trend strategy.
Social button for Joomla