

")
 Fibonacci indicators are one of the main instruments for analysis in the internet trading. It should be noted that besides the effectiveness of this analytical instrument, this indicator attracts the attention by the well-known validity of numbers, which are used to build this indicator. And, before we describe the Fibonacci indicators principle of work, it is worth to draw attention on the stricture of this indicator’ parameters.
Numbers 1, 2, 3, 5, 8, 13, 21 … and so on are considered as numbers of Fibonacci. This row of numbers is comprised by numbers where each number consists of the sum of two previous numbers. This algorithm was found by Leonardo Fibonacci. It is widely considered that numbers of Fibonacci which form this indicator are directly connected with the “Golden ration”. According to this theory everything in our life, from us to the Universe is created by a simple mathematic principle. Thus, it is proved long time ago that the price changes on the market, which is stimulated by people often shows this dynamics. That is why the process of trading development did not stay aside and Ralph Nelson Elliot implemented calculation with the aid of Fibonacci numbers.
Two examples are provided below. They show the way to use two of the most widespread Fibonacci indicators. At the same time parameters which are used are the same. They were found by positive whole number division with Fibonacci numbers.
1. Fibonacci levels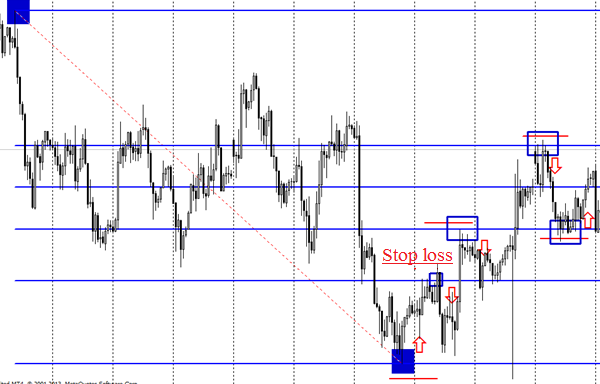
With the use of Fibonacci indicators one can find a perspective on the levels of support and levels of resistance. At the same time it is possible to determine the tendency for the pullback or for the reversal of the main price movement. But previously one should add an indicator on the extremes depending on the prospective trends. When one has drowned levels the actions which should be taken become clear. In this case the system works on bounce or penetration. One should bear in mind the stop-loss which are better to be placed according to the Fibonacci levels. If the bounce from the line occurred, then the trader should open a sell order with a profit on the previous level or the trader should follow the price movements and its moving back. The stop-loss should be placed immediately after the level of the bounce.
2. A Fan
The Fibonacci fan works with the same parameters but in the different principle. If a line indicator forms its horizontal levels of support and resistance, the fan is showing the same resistance of support, but oriented according the price graph trend. 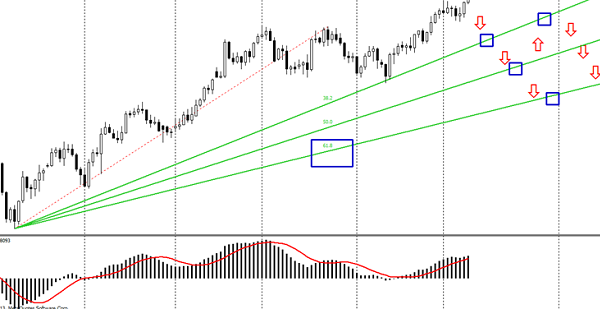
In the beginning two extremes of the graph should be found as well that is minimum and maximum. When the fan is set in the graph direction then we will the following picture. As you can see there is no need for explanation. 61,8 is considered as one of the main levels among Fibonacci indicators. If this line is penetrated, then there is a high possibility that the whole price trend will be changed completely. As for the levels the tactic is the same with the tactic which is described above. But the fan strategy has the distinguishable feature. If it is used in pair with the additional indicator, then before in crosses the level of 38,2 the trader can work on the trend extension, holding the long position. But the trader should be conscious here with the time passing, diapasons between fans’ lines are widen and later the penetration will happen, stronger with be the fall to the next level. If the level 61,8 is overcame, then the trader can prepare for the fan reversal.
Thus, using the Fibonacci indicators the trader works effectively in the internet-trading. The use of levels with these numbers provides trader with the obvious picture of the price movements in different directions, and at the same time there are still many systems where additional indicators are used. In the aggregate with them the Fibonacci indicators provides us with quite effective indexes.
Social button for Joomla