

")
Nowadays there are huge amount of various types of indicators, which are used as graphical analysis tools. There is a kind or class of indicators, which show volumes, among all analytical tools based on the trend, overbought and oversold indicators.
The most common and simple, among them is, of course, a Volumes indicator. This is a classic example that shows the probability of future price movements. There is a simple and reliable argument, which proves the fact that this indicator does not late. It’s principle of operation is simple. If every subsequent column is higher then the previous one is in green color. If every subsequent column is lower then the previous one it is in red color.
Before you find the method for using this technical tools one important issue should be mentioned. The Volumes indicator does not reflect the amount of expended money for purchasing or selling at a certain moment of time. There is no such indicator, which could reflect the sum of money, which form the demand and supply for a particular currency as it has not been invented yet. Nevertheless, the indicator works. The explanation of this phenomenon is simple. The Volumes indicator shows how many transactions has been conducted and completed for a certain period of time. At the same time this indicator shows its value in a very simple way that is by vertical columns.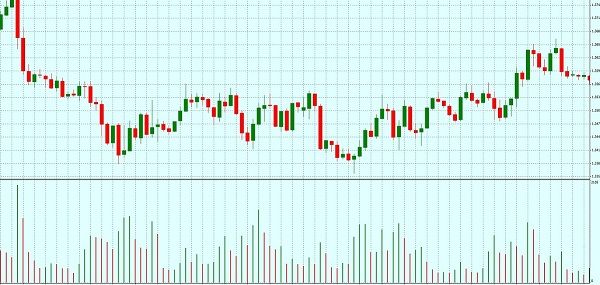
If you analysis the current market situation, with the aid of this indicator, you should understand that the price movement and the movement (growth) of the histograms column can be multilateral. Here you meet the complexity of interpretation. But, we will come back to it later. If the price and volume indicator grow, it means that the growing trend is likely to continue. The situation is similar when the price falls. When the volume indicator grows there is still possibility for decline. If several growing green columns in a row, when price is moving, and then the lower red column occur, while the price movement is similar, it means that the trend is likely to change soon.
The interpretation of histograms candles and column is of great importance. For example, if the volume is not large and the price has risen significantly, it means that "bears" are very weak, as a law volume of transactions could push the price significantly. But on the other hand, the amount of transactions may not be high, but the amount of money supply can be enormous and will push the currency to rise as well.
This mechanism is the same with the reverse situation. If a large volume is indicated and the price movement is very insignificant it can mean only two things. The volume of transactions is high but the money supply is too little to move the price. In this case you should understand that the main players are out of the market. Or the volume of transactions and the size of the money supply are very high from both "bull" and "bears" side. Therefore, the price has moved, but not essentially. In this you should be vigilant, as the subsequent movement can be very strong when someone wins and takes over. Those who do not react on time or miscalculated the direction of prices will simply lose.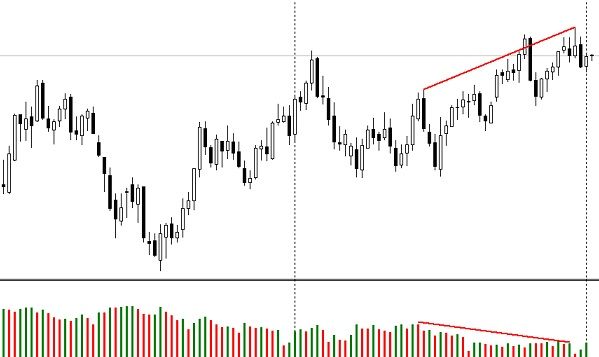
The Volumes indicator can give another important signal that is the famous convergence and divergence signal. The image shows the indicator with its histogram and divergence.
Summing up everything, what is mentioned above, without a doubt we can say that the mode of operation and use of such an indicator as the Volumes indicator is not something very unusual. Like everything else it works simply. This indicator is indeed the certain mathematical calculation and nothing more then that. But all indicators have the same problem. Their effectiveness can be raised only if you use the complex analysis. And to be more precise, you just should add some additional tools such as another indicator or just levels. Anyway, it will improve your system.
Social button for Joomla